Lumber Liquidators 2007 Annual Report Download - page 57
Download and view the complete annual report
Please find page 57 of the 2007 Lumber Liquidators annual report below. You can navigate through the pages in the report by either clicking on the pages listed below, or by using the keyword search tool below to find specific information within the annual report.-
 1
1 -
2
-
3
-
4
-
5
-
6
-
7
-
8
-
9
-
10
-
11
-
12
-
13
-
14
-
15
-
16
-
17
-
18
-
19
-
20
-
21
-
22
-
23
-
24
-
25
-
26
-
27
-
28
-
29
-
30
-
31
-
32
-
33
-
34
-
35
-
36
-
37
-
38
-
39
-
40
-
41
-
42
-
43
-
44
-
45
-
46
-
 47
47 -
 48
48 -
 49
49 -
 50
50 -
 51
51 -
 52
52 -
 53
53 -
 54
54 -
 55
55 -
 56
56 -
 57
57 -
 58
58 -
 59
59 -
 60
60 -
 61
61 -
 62
62 -
 63
63 -
 64
64 -
 65
65 -
 66
66 -
 67
67 -
68
-
69
-
70
-
71
-
72
-
73
-
74
-
75
-
76
-
77
-
78
-
79
-
80
 |
 |

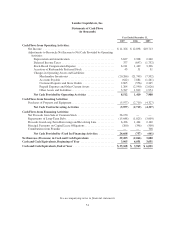
Lumber Liquidators, Inc.
Statements of Cash Flows
(in thousands)
Year Ended December 31,
2007 2006 2005
Cash Flows from Operating Activities:
Net Income .................................................. $11,326 $ 12,898 $10,713
Adjustments to Reconcile Net Income to Net Cash Provided by Operating
Activities:
Depreciation and Amortization ............................... 3,627 2,908 2,240
Deferred Income Taxes ..................................... 377 (697) (1,732)
Stock-Based Compensation Expense .......................... 6,211 1,449 3,306
Accretion of Redeemable Preferred Stock ...................... 43 51 51
Changes in Operating Assets and Liabilities:
Merchandise Inventories ................................ (20,266) (21,749) (7,502)
Accounts Payable ..................................... (642) 7,884 (1,261)
Customer Deposits and Store Credits ...................... 2,805 (556) 2,245
Prepaid Expenses and Other Current Assets ................. 1,264 (2,590) (2,026)
Other Assets and Liabilities .............................. 3,767 1,812 1,954
Net Cash Provided by Operating Activities ................... 8,512 1,410 7,988
Cash Flows from Investing Activities:
Purchases of Property and Equipment .............................. (5,977) (2,719) (4,327)
Net Cash Used in Investing Activities ........................ (5,977) (2,719) (4,327)
Cash Flows from Financing Activities:
Net Proceeds from Sale of Common Stock .......................... 36,150 — —
Repayments of Long-Term Debt .................................. (15,648) (1,825) (3,009)
Proceeds from Long-Term Borrowings and Revolving Line ............ 6,426 1,464 2,140
Principal Payments on Capital Lease Obligations ..................... (260) (396) (500)
Contributions from Founder ..................................... — — 708
Net Cash Provided by (Used In) Financing Activities ........... 26,668 (757) (661)
Net Increase (Decrease) in Cash and Cash Equivalents ................. 29,203 (2,066) 3,000
Cash and Cash Equivalents, Beginning of Year ........................ 3,965 6,031 3,031
Cash and Cash Equivalents, End of Year ............................. $ 33,168 $ 3,965 $ 6,031
See accompanying notes to financial statements
51