Lumber Liquidators 2007 Annual Report Download - page 46
Download and view the complete annual report
Please find page 46 of the 2007 Lumber Liquidators annual report below. You can navigate through the pages in the report by either clicking on the pages listed below, or by using the keyword search tool below to find specific information within the annual report.Liquidity and Capital Resources
Our principal liquidity requirements have been to meet our working capital and capital expenditure needs.
Until our IPO, we funded these requirements primarily through cash flows from operations and short-term and
long-term borrowings under our senior secured loan agreement. We completed our IPO in November 2007,
receiving net proceeds of approximately $36.2 million. We used a portion of those proceeds to repay the $6.6
million outstanding under the term-loan portion of our senior secured loan agreement. We had no amounts
outstanding under our $25.0 million revolving credit facility when we received the net proceeds.
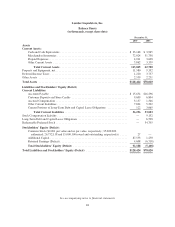
Our principal sources of liquidity are $33.2 million of cash and cash equivalents at December 31, 2007, our
cash flow from operations, and $24.7 million of availability under the revolving credit facility. We expect to use
this liquidity for general corporate purposes, including providing additional long-term capital to support the
growth of our business (primarily through opening new stores) and maintaining our existing stores. In 2008, we
intend to:
• open between 30 and 40 new store locations;
• continue the remodeling of existing store showrooms to enhance consistency in presentation;
• upgrade our finishing line in Toano, Virginia;
• increase efficiency and enhance our information technology (“IT”) systems, including security, disaster
recovery; and
• upgrade our customer service telephony intelligence.
Together with general capital requirements, we expect capital expenditures to total between $5 million and
$7 million in 2008.
We believe that our cash flow from operations, together with our existing liquidity sources, will be
sufficient to fund our operations and anticipated capital expenditures over at least the next 24 months.
Cash and Cash Equivalents
During 2007, cash and cash equivalents increased $29.2 million to $33.2 million. We received $36.2 million
from our IPO in November 2007 and operating activities provided $8.5 million. These increases of cash and cash
equivalents were partially offset by the use of $6.0 million to purchase property and equipment, and $9.2 million
of net repayments of long-term debt. The primary contributors to the $2.1 million decrease in cash and cash
equivalents during 2006 were the use of $2.7 million of cash for purchases of property and equipment and $1.8
million of cash to repay scheduled long-term debt outstanding under the term-loan portion of our senior secured
loan agreement, partially offset by $1.4 million of cash provided by operating activities and borrowings of $1.5
million under our revolving loan agreement. In 2005, cash and cash equivalents increased $3.0 million, to $6.0
million, from $3.0 million at the end of 2004. The primary contributor to the increase in cash and cash
equivalents during 2005 was $8.0 million of cash provided by operating activities and borrowings of $2.1 million
under our senior secured loan agreement, partially offset by the use of $4.3 million of cash for purchases of
property and equipment and $3.0 million of cash to repay long-term debt outstanding under our senior secured
loan agreement.
Cash Flows
Operating Activities. Net cash provided by operating activities was $8.5 million for 2007 compared to $1.4
million for 2006 and $8.0 million for 2005. The $7.1 million increase from 2006 to 2007 was primarily
attributable to more profitable operations, exclusive of the $4.8 million increase in non-cash stock-based
compensation expense and a lesser net build in net operating assets. The decrease in the build of net operating
assets was primarily a result of an increase in customer deposits and store credits and less of a build in
40


