Lumber Liquidators 2007 Annual Report Download - page 45
Download and view the complete annual report
Please find page 45 of the 2007 Lumber Liquidators annual report below. You can navigate through the pages in the report by either clicking on the pages listed below, or by using the keyword search tool below to find specific information within the annual report.-
 1
1 -
2
-
3
-
4
-
5
-
6
-
7
-
8
-
9
-
10
-
11
-
12
-
13
-
14
-
15
-
16
-
17
-
18
-
19
-
20
-
21
-
22
-
23
-
24
-
25
-
26
-
27
-
28
-
29
-
30
-
31
-
32
-
33
-
34
-
 35
35 -
 36
36 -
 37
37 -
 38
38 -
 39
39 -
 40
40 -
 41
41 -
 42
42 -
 43
43 -
 44
44 -
 45
45 -
 46
46 -
 47
47 -
 48
48 -
 49
49 -
 50
50 -
 51
51 -
 52
52 -
 53
53 -
 54
54 -
 55
55 -
56
-
57
-
58
-
59
-
60
-
61
-
62
-
63
-
64
-
65
-
66
-
67
-
68
-
69
-
70
-
71
-
72
-
73
-
74
-
75
-
76
-
77
-
78
-
79
-
80
 |
 |

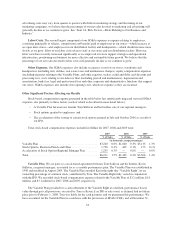
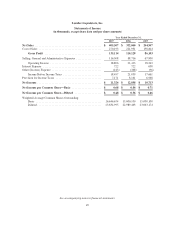
Quarterly Financial Data
The following table sets forth our unaudited quarterly results of operations for 2006 and 2007. Information
for each of these periods has been prepared on the same basis as the audited financial statements included
elsewhere in this report. This information includes all adjustments, which consist only of normal and recurring
adjustments, management considers necessary for the fair presentation of such data. This data should be read in
conjunction with the audited financial statements included elsewhere in this report. The results of operations for
historical periods are not necessarily indicative of results for any future period.
Quarter Ended
March 31,
2007
June 30,
2007
September 30,
2007
December 31,
2007
(dollar amounts in thousands)
Net Sales ......................................... $92,022 $105,725 $102,050 $105,510
Gross Profit ....................................... $30,571 $ 34,375 $ 34,447 $ 35,721
Selling, General and Administrative Expenses(1) .......... $26,816 $ 30,415 $ 28,260 $ 30,817
Operating Income ................................... $ 3,755 $ 3,960 $ 6,187 $ 4,904
Net Income ........................................ $ 2,231 $ 2,345 $ 3,701 $ 3,049
Number of Stores Opened in Quarter ................... 2 10 8 5
Comparable Sales Increase ........................... 8.5% 9.0% 8.4% 8.6%
(1) Selling, General and Administrative Expenses includes $403, $2,649, ($150) and $318 of variable plan
stock compensation expense for the quarters ended March 31, June 30, September 30, and December 31,
respectively, and the quarter ended December 31, 2007 includes $1,224 for the acceleration of stock options
and the recognition of the expense associated with the 2006 Regional Plan due to the IPO.
Quarter Ended
March 31,
2006
June 30,
2006
September 30,
2006
December 31,
2006
(dollar amounts in thousands)
Net Sales .......................................... $76,051 $88,078 $83,090 $84,841
Gross Profit ........................................ $26,409 $29,453 $27,402 $26,865
Selling, General and Administrative Expenses(1) ........... $20,537 $21,487 $22,587 $24,105
Operating Income .................................... $ 5,872 $ 7,966 $ 4,815 $ 2,760
Net Income ......................................... $ 3,560 $ 4,819 $ 2,896 $ 1,623
Number of Stores Opened in Quarter(2) .................. 4 5 1 6
Comparable Sales Increase ............................ 24.1% 21.6% 12.8% 12.2%
(1) Selling, General and Administrative Expenses includes $260 of variable plan stock compensation expense
for each of the quarters ended March 31, June 30, September 30, and December 31.
(2) We also closed a location, a laminate flooring-only store established to operate during the remaining lease
period of a relocated store, in May 2006.
Our quarterly results of operations fluctuate depending on the timing of our advertising expenses and the
timing of and income contributed by new stores. Our performance has also been impacted by certain of our
initiatives to improve our infrastructure and to position our business to support sustainable growth and
profitability in the future.
Our net sales also fluctuate slightly as a result of seasonal factors. We experience slightly higher net sales in
spring and fall, when more home remodeling and home building activities are taking place, and slightly lower net
sales in holiday periods and during the hottest summer months. These seasonal fluctuations, however, are
minimized to some extent by our national presence, as markets experience different seasonal characteristics.
39