Lumber Liquidators 2007 Annual Report Download - page 5
Download and view the complete annual report
Please find page 5 of the 2007 Lumber Liquidators annual report below. You can navigate through the pages in the report by either clicking on the pages listed below, or by using the keyword search tool below to find specific information within the annual report.-
 1
1 -
 2
2 -
 3
3 -
 4
4 -
 5
5 -
 6
6 -
 7
7 -
 8
8 -
 9
9 -
 10
10 -
 11
11 -
 12
12 -
 13
13 -
 14
14 -
 15
15 -
 16
16 -
17
-
18
-
19
-
20
-
21
-
22
-
23
-
24
-
25
-
26
-
27
-
28
-
29
-
30
-
31
-
32
-
33
-
34
-
35
-
36
-
37
-
38
-
39
-
40
-
41
-
42
-
43
-
44
-
45
-
46
-
47
-
48
-
49
-
50
-
51
-
52
-
53
-
54
-
55
-
56
-
57
-
58
-
59
-
60
-
61
-
62
-
63
-
64
-
65
-
66
-
67
-
68
-
69
-
70
-
71
-
72
-
73
-
74
-
75
-
76
-
77
-
78
-
79
-
80
 |
 |
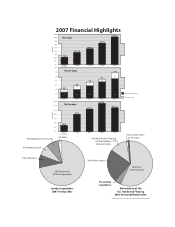
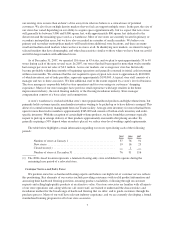
Net Sales
$100
$150
$200
$250
$300
$350
$400
$450
$50
$0 2003
(unaudited) 2004 2005 2006 2007
$171.8
$244.9
$332.1
$405.3
MILLIONS
$100.9
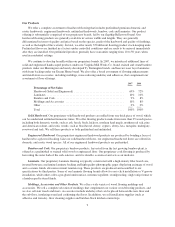
69% Hardwood
(Solid & Engineered)
10% Laminates
9% Bamboo & Cork
10% Moldings & Accessories 2% Other
Lumber Liquidators
2007 Product Mix
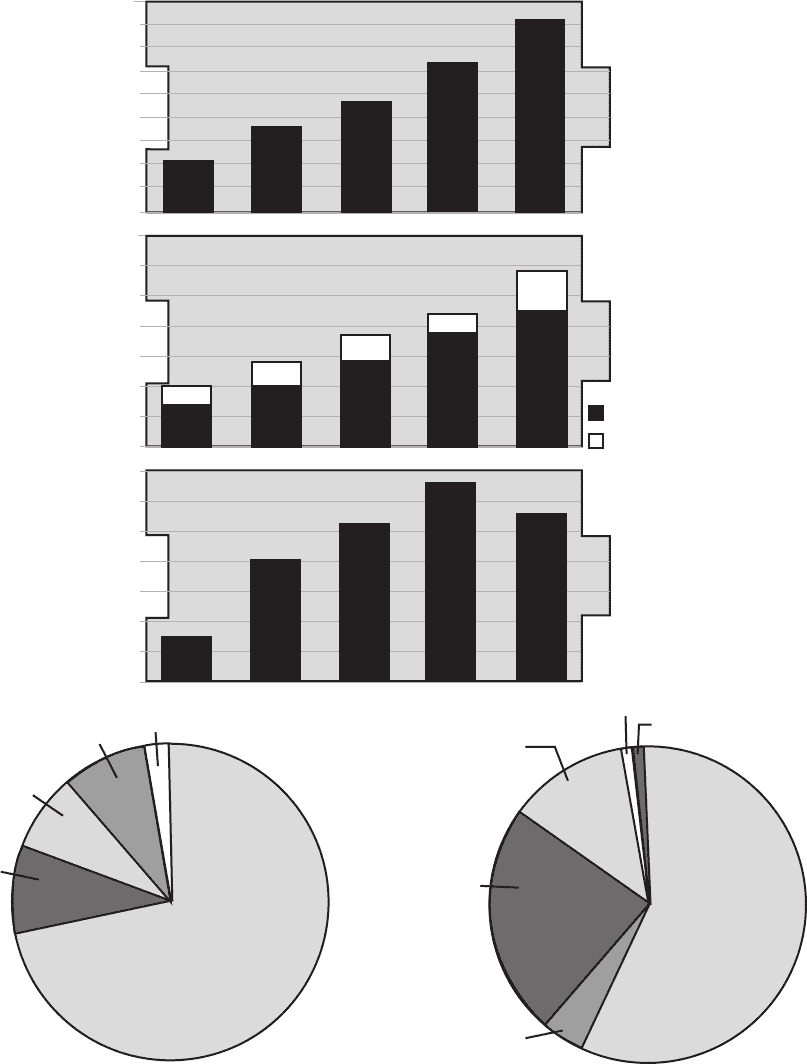
53% Floor
Covering Stores
24% Home Centers
14% Hard Surface Flooring
& Other Building
Material Dealers
7% Lumber
Liquidators
Marketshare of the
U.S. Hardwood Flooring
2007 Estimated Retail Sales*
1% Other
1% Furniture Stores
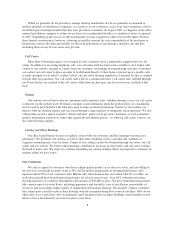
2003
(unaudited) 2004 2005 2006 2007
Net Income
$2.6
$8.0
$10.7
$12.9
$11.3
$0
$2.0
$4.0
$6.0
$8.0
$10.0
$12.0
$14.0
MILLIONS
*Catalina Research Inc.’s November 2007 Wood Flooring Report
2003 2004 2005 2006 2007
140
Beginning of the year
Net new stores
0
20
40
60
80
100
120
15
17
19
15
25
Stores Open
25 40 57 76 91
40
57
76
91
116
2007 Financial Highlights