LinkedIn 2015 Annual Report Download - page 86
Download and view the complete annual report
Please find page 86 of the 2015 LinkedIn annual report below. You can navigate through the pages in the report by either clicking on the pages listed below, or by using the keyword search tool below to find specific information within the annual report.-
 1
1 -
2
-
3
-
4
-
5
-
6
-
7
-
8
-
9
-
10
-
11
-
12
-
13
-
14
-
15
-
16
-
17
-
18
-
19
-
20
-
21
-
22
-
23
-
24
-
25
-
26
-
27
-
28
-
29
-
30
-
31
-
32
-
33
-
34
-
35
-
36
-
37
-
38
-
39
-
40
-
41
-
42
-
43
-
44
-
45
-
46
-
47
-
48
-
49
-
50
-
51
-
52
-
53
-
54
-
55
-
56
-
57
-
58
-
59
-
60
-
61
-
62
-
63
-
64
-
65
-
66
-
67
-
68
-
69
-
70
-
71
-
72
-
73
-
74
-
75
-
 76
76 -
 77
77 -
 78
78 -
 79
79 -
 80
80 -
 81
81 -
 82
82 -
 83
83 -
 84
84 -
 85
85 -
 86
86 -
 87
87 -
 88
88 -
 89
89 -
 90
90 -
 91
91 -
 92
92 -
 93
93 -
 94
94 -
 95
95 -
 96
96 -
97
-
98
-
99
-
100
-
101
-
102
-
103
-
104
-
105
-
106
-
107
-
108
-
109
-
110
-
111
-
112
-
113
-
114
-
115
-
116
-
117
-
118
-
119
-
120
-
121
-
122
-
123
-
124
-
125
-
126
-
127
-
128
-
129
-
130
-
131
-
132
-
133
-
134
-
135
-
136
-
137
-
138
-
139
-
140
-
141
-
142
-
143
 |
 |

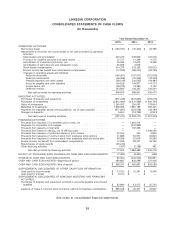
LINKEDIN CORPORATION
CONSOLIDATED STATEMENTS OF OPERATIONS
(In thousands, except per share data)
Year Ended December 31,
2015 2014 2013
Net revenue .................................... $2,990,911 $2,218,767 $1,528,545
Costs and expenses:
Cost of revenue (exclusive of depreciation and amortization
shown separately below) ........................ 418,858 293,797 202,908
Sales and marketing ............................ 1,048,129 774,411 522,100
Product development ............................ 775,660 536,184 395,643
General and administrative ........................ 478,734 341,294 225,566
Depreciation and amortization ...................... 420,472 236,946 134,516
Total costs and expenses ..................... 3,141,853 2,182,632 1,480,733
Income (loss) from operations ....................... (150,942) 36,135 47,812
Other income (expense), net:
Interest income ................................ 10,571 4,971 2,895
Interest expense ............................... (50,882) (6,797) —
Other, net .................................... (23,477) (3,104) (1,479)
Other income (expense), net ................... (63,788) (4,930) 1,416
Income (loss) before income taxes .................... (214,730) 31,205 49,228
Provision (benefit) for income taxes ................... (49,969) 46,525 22,459
Net income (loss) ................................ (164,761) (15,320) 26,769
Accretion of redeemable noncontrolling interest ........... (1,383) (427) —
Net income (loss) attributable to common stockholders ...... $ (166,144) $ (15,747) $ 26,769
Net income (loss) per share attributable to common
stockholders:
Basic ...................................... $ (1.29) $ (0.13) $ 0.24
Diluted ..................................... $ (1.29) $ (0.13) $ 0.23
Weighted-average shares used to compute net income (loss)
per share attributable to common stockholders:
Basic ...................................... 129,024 122,800 113,643
Diluted ..................................... 129,024 122,800 118,944
See notes to consolidated financial statements.
84