LinkedIn 2015 Annual Report Download - page 66
Download and view the complete annual report
Please find page 66 of the 2015 LinkedIn annual report below. You can navigate through the pages in the report by either clicking on the pages listed below, or by using the keyword search tool below to find specific information within the annual report.-
 1
1 -
2
-
3
-
4
-
5
-
6
-
7
-
8
-
9
-
10
-
11
-
12
-
13
-
14
-
15
-
16
-
17
-
18
-
19
-
20
-
21
-
22
-
23
-
24
-
25
-
26
-
27
-
28
-
29
-
30
-
31
-
32
-
33
-
34
-
35
-
36
-
37
-
38
-
39
-
40
-
41
-
42
-
43
-
44
-
45
-
46
-
47
-
48
-
49
-
50
-
51
-
52
-
53
-
54
-
55
-
 56
56 -
 57
57 -
 58
58 -
 59
59 -
 60
60 -
 61
61 -
 62
62 -
 63
63 -
 64
64 -
 65
65 -
 66
66 -
 67
67 -
 68
68 -
 69
69 -
 70
70 -
 71
71 -
 72
72 -
 73
73 -
 74
74 -
 75
75 -
 76
76 -
77
-
78
-
79
-
80
-
81
-
82
-
83
-
84
-
85
-
86
-
87
-
88
-
89
-
90
-
91
-
92
-
93
-
94
-
95
-
96
-
97
-
98
-
99
-
100
-
101
-
102
-
103
-
104
-
105
-
106
-
107
-
108
-
109
-
110
-
111
-
112
-
113
-
114
-
115
-
116
-
117
-
118
-
119
-
120
-
121
-
122
-
123
-
124
-
125
-
126
-
127
-
128
-
129
-
130
-
131
-
132
-
133
-
134
-
135
-
136
-
137
-
138
-
139
-
140
-
141
-
142
-
143
 |
 |

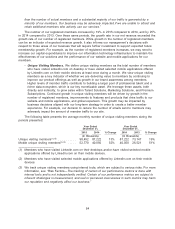
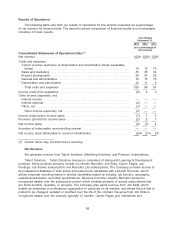
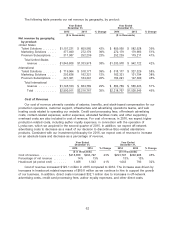
Product development expenses increased $239.5 million in 2015 compared to 2014. The increase
was driven by an increase in headcount related expenses of $214.1 million as a result of our focus on
developing new features and products that create value for our members. We also experienced an
increase in consulting and outside services of $12.0 million.
Product development expenses increased $140.5 million in 2014 compared to 2013. The increase
was primarily attributable to an increase in headcount related expenses of $124.0 million as a result of
our focus on developing new features and products that create value for our members. We also
experienced increases in facilities and related costs of $13.6 million and web hosting service expenses
of $2.8 million.
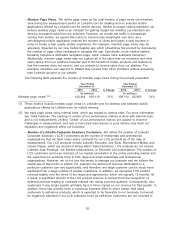
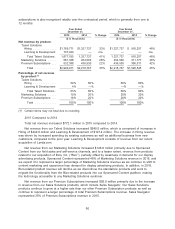
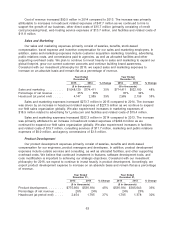
General and Administrative
Our general and administrative expenses primarily consist of salaries, benefits, and stock-based
compensation for our executive, finance, legal, information technology, human resources and other
administrative employees. In addition, general and administrative expenses include outside consulting,
legal and accounting services, and facilities and other supporting overhead costs not allocated to other
departments. Consistent with our investment philosophy for 2016, we expect general and administrative
expenses to increase on an absolute basis and decrease as a percentage of revenue.
Year Ended Year Ended
December 31, December 31,
2015 2014 % Change 2014 2013 % Change
($ in thousands) ($ in thousands)
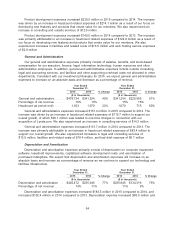
General and administrative ..... $478,734 $341,294 40% $341,294 $225,566 51%
Percentage of net revenue ..... 16% 15% 15% 15%
Headcount (at period end) ..... 1,303 1,070 22% 1,070 715 50%
General and administrative expenses increased $137.4 million in 2015 compared to 2014. The
increase was driven by an increase in headcount related expenses of $119.7 million to support our
overall growth, of which $29.1 million was related to one-time charges in connection with our
acquisition of Lynda.com. We also experienced an increase in consulting services of $14.2 million.
General and administrative expenses increased $115.7 million in 2014 compared to 2013. The
increase was primarily attributable to an increase in headcount related expenses of $83.4 million to
support our overall growth. We also experienced increases in legal and consulting services of
$13.9 million, facilities and related costs of $10.4 million, and bad debt expense of $6.7 million.
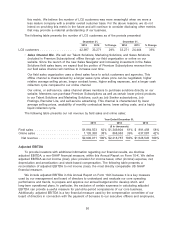
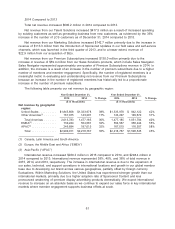
Depreciation and Amortization
Depreciation and amortization expenses primarily consist of depreciation on computer equipment,
software, leasehold improvements, capitalized software development costs, and amortization of
purchased intangibles. We expect that depreciation and amortization expenses will increase on an
absolute basis and increase as a percentage of revenue as we continue to expand our technology and
facilities infrastructure.
Year Ended Year Ended
December 31, December 31,
2015 2014 % Change 2014 2013 % Change
($ in thousands) ($ in thousands)
Depreciation and amortization . . $420,472 $236,946 77% $236,946 $134,516 76%
Percentage of net revenue ..... 14% 11% 11% 9%
Depreciation and amortization expenses increased $183.5 million in 2015 compared to 2014, and
increased $102.4 million in 2014 compared to 2013. Depreciation expense increased $83.5 million and
64