LinkedIn 2015 Annual Report Download - page 72
Download and view the complete annual report
Please find page 72 of the 2015 LinkedIn annual report below. You can navigate through the pages in the report by either clicking on the pages listed below, or by using the keyword search tool below to find specific information within the annual report.-
 1
1 -
2
-
3
-
4
-
5
-
6
-
7
-
8
-
9
-
10
-
11
-
12
-
13
-
14
-
15
-
16
-
17
-
18
-
19
-
20
-
21
-
22
-
23
-
24
-
25
-
26
-
27
-
28
-
29
-
30
-
31
-
32
-
33
-
34
-
35
-
36
-
37
-
38
-
39
-
40
-
41
-
42
-
43
-
44
-
45
-
46
-
47
-
48
-
49
-
50
-
51
-
52
-
53
-
54
-
55
-
56
-
57
-
58
-
59
-
60
-
61
-
 62
62 -
 63
63 -
 64
64 -
 65
65 -
 66
66 -
 67
67 -
 68
68 -
 69
69 -
 70
70 -
 71
71 -
 72
72 -
 73
73 -
 74
74 -
 75
75 -
 76
76 -
 77
77 -
 78
78 -
 79
79 -
 80
80 -
 81
81 -
 82
82 -
83
-
84
-
85
-
86
-
87
-
88
-
89
-
90
-
91
-
92
-
93
-
94
-
95
-
96
-
97
-
98
-
99
-
100
-
101
-
102
-
103
-
104
-
105
-
106
-
107
-
108
-
109
-
110
-
111
-
112
-
113
-
114
-
115
-
116
-
117
-
118
-
119
-
120
-
121
-
122
-
123
-
124
-
125
-
126
-
127
-
128
-
129
-
130
-
131
-
132
-
133
-
134
-
135
-
136
-
137
-
138
-
139
-
140
-
141
-
142
-
143
 |
 |

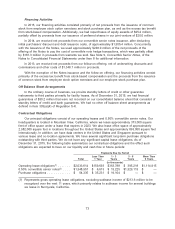
For the Three Months Ended
Dec 31, Sep 30, Jun 30, Mar 31, Dec 31, Sep 30, Jun 30, Mar 31,
2015 2015 2015 2015 2014 2014 2014 2014
(in thousands, except customer and headcount data)
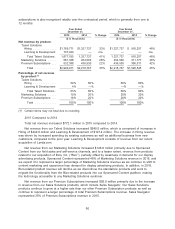
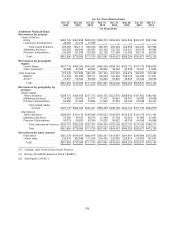
Other Financial and Operational
Data:
Adjusted EBITDA(1) ........... $248,502 $208,094 $163,347 $159,861 $178,918 $151,295 $145,256 $116,745
Number of registered members (at
period end) .............. 413,671 396,254 379,887 363,929 346,731 331,517 313,428 296,466
LinkedIn Corporate Solutions
customers (at period end) ..... 42,987 39,726 37,425 34,764 33,271 30,314 28,080 25,844
Headcount (at period end):
United States ............. 6,258 6,188 5,842 5,084 4,617 4,323 3,861 3,669
International .............. 3,114 3,085 2,893 2,549 2,280 2,119 1,897 1,747
Total .................... 9,372 9,273 8,735 7,633 6,897 6,442 5,758 5,416
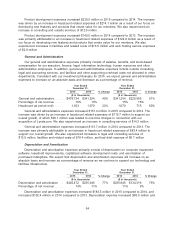
(1) We define adjusted EBITDA as net income (loss), plus: provision for income taxes, other (income) expense, net,
depreciation and amortization, and stock-based compensation. See ‘‘Adjusted EBITDA’’ in Item 6 ‘‘Selected
Financial Data’’ for more information.
For the Three Months Ended
Dec 31, Sep 30, Jun 30, Mar 31, Dec 31, Sep 30, Jun 30, Mar 31,
2015 2015 2015 2015 2014 2014 2014 2014
(As Adjusted)(1)
(in thousands)
Reconciliation of Adjusted
EBITDA:
Net income (loss) ........ $ (7,911) $(46,911) $ (67,500) $ (42,439) $ 3,095 $ (4,162) $ (934) $ (13,319)
Provision (benefit) for income
taxes .............. (24,064) (10,429) (26,048) 10,572 3,774 12,917 16,253 13,581
Other (income) expense, net 16,082 20,659 12,400 14,647 7,305 (152) (1,197) (1,026)
Depreciation and
amortization .......... 129,595 117,901 99,004 73,972 71,118 59,782 56,306 49,740
Stock-based compensation . 134,800 126,874 145,491 103,109 93,626 82,910 74,828 67,769
Adjusted EBITDA ........ $248,502 $208,094 $163,347 $159,861 $178,918 $151,295 $145,256 $116,745
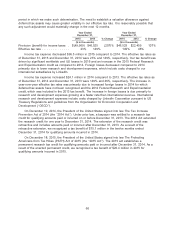
(1) In the fourth quarter of 2015, we adopted new authoritative guidance on determining whether the host contract in a
hybrid financial instrument issued in the form of a share is more akin to debt or to equity on a modified retrospective
approach. As such, in the third quarter of 2015, we have recorded additional expense of $6.9 million to Other
income (expense), net, which increased our Net loss attributable to common stockholders by a corresponding
amount. The impact to the fourth quarter of 2015 was additional expense of $1.9 million to Other income (expense),
net.
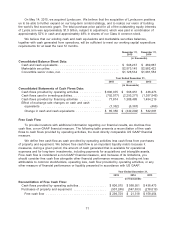
Liquidity and Capital Resources
As of December 31, 2015, we had cash and cash equivalents of $546.2 million and marketable
securities of $2,573.1 million. Our cash equivalents and marketable securities are comprised primarily
of US treasury securities, US agency securities, corporate debt securities, commercial paper and
money market funds. As of December 31, 2015, the amount of cash and cash equivalents held by
foreign subsidiaries was $206.7 million. If these funds are needed for our domestic operations, we
would be required to accrue and pay US taxes to repatriate these funds to the extent these funds
exceed amounts owed to the US parent entity. However, our intent is to permanently reinvest these
funds outside the United States and our current plans do not demonstrate a need to repatriate them to
fund our domestic operations. We do not provide for federal income taxes on the undistributed earnings
of our foreign subsidiaries. However, we believe the income tax liability would be insignificant if these
earnings were to be repatriated.
70