LinkedIn 2015 Annual Report Download - page 126
Download and view the complete annual report
Please find page 126 of the 2015 LinkedIn annual report below. You can navigate through the pages in the report by either clicking on the pages listed below, or by using the keyword search tool below to find specific information within the annual report.-
 1
1 -
2
-
3
-
4
-
5
-
6
-
7
-
8
-
9
-
10
-
11
-
12
-
13
-
14
-
15
-
16
-
17
-
18
-
19
-
20
-
21
-
22
-
23
-
24
-
25
-
26
-
27
-
28
-
29
-
30
-
31
-
32
-
33
-
34
-
35
-
36
-
37
-
38
-
39
-
40
-
41
-
42
-
43
-
44
-
45
-
46
-
47
-
48
-
49
-
50
-
51
-
52
-
53
-
54
-
55
-
56
-
57
-
58
-
59
-
60
-
61
-
62
-
63
-
64
-
65
-
66
-
67
-
68
-
69
-
70
-
71
-
72
-
73
-
74
-
75
-
76
-
77
-
78
-
79
-
80
-
81
-
82
-
83
-
84
-
85
-
86
-
87
-
88
-
89
-
90
-
91
-
92
-
93
-
94
-
95
-
96
-
97
-
98
-
99
-
100
-
101
-
102
-
103
-
104
-
105
-
106
-
107
-
108
-
109
-
110
-
111
-
112
-
113
-
114
-
115
-
 116
116 -
 117
117 -
 118
118 -
 119
119 -
 120
120 -
 121
121 -
 122
122 -
 123
123 -
 124
124 -
 125
125 -
 126
126 -
 127
127 -
 128
128 -
 129
129 -
 130
130 -
 131
131 -
 132
132 -
 133
133 -
 134
134 -
 135
135 -
 136
136 -
137
-
138
-
139
-
140
-
141
-
142
-
143
 |
 |

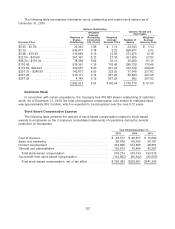
The weighted-average grant date fair value of options granted, excluding assumed acquisition-
related stock options, was $99.13, $76.39 and $89.13, for the years ended December 31, 2015, 2014
and 2013, respectively. The weighted-average grant date fair value of assumed acquisition-related
stock options was $168.34, $164.71 and $166.08 for the years ended December 31, 2015, 2014 and
2013, respectively.
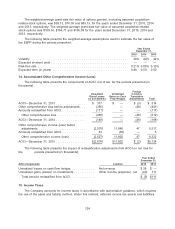
The following table presents the weighted-average assumptions used to estimate the fair value of
the ESPP during the periods presented:
Year Ended
December 31,
2015 2014 2013
Volatility ..................................................... 39% 44% 42%
Expected dividend yield .......................................... — — —
Risk-free rate ................................................. 0.21% 0.06% 0.10%
Expected term (in years) ......................................... 0.49 0.50 0.50
14. Accumulated Other Comprehensive Income (Loss)
The following table presents the components of AOCI, net of tax, for the periods presented (in
thousands):
Foreign
Unrealized Unrealized Currency
Gains/Losses Gains on Cash Translation
on Investments Flow Hedges Adjustments Total
AOCI—December 31, 2013 ................ $ 317 $ — $ (3) $ 314
Other comprehensive loss before adjustments . . . (355) — (46) (401)
Amounts reclassified from AOCI ............. (111) — — (111)
Other comprehensive loss ............... (466) — (46) (512)
AOCI—December 31, 2014 ................ (149) — (49) (198)
Other comprehensive income (loss) before
adjustments ......................... (2,570) 11,840 47 9,317
Amounts reclassified from AOCI ............. 43 (38) — 5
Other comprehensive income (loss) ........ (2,527) 11,802 47 9,322
AOCI—December 31, 2015 ................ $(2,676) $11,802 $ (2) $9,124
The following table presents the impact of reclassification adjustments from AOCI on net loss for
the periods presented (in thousands):
Year Ended
December 31,
AOCI Components Location 2015 2014
Unrealized losses on cash flow hedges ............. Net revenue $ 38 $ —
Unrealized gains (losses) on investments ............ Other income (expense), net (43) 111
Total amount reclassified from AOCI .............. $ (5) $111
15. Income Taxes
The Company accounts for income taxes in accordance with authoritative guidance, which requires
the use of the asset and liability method. Under this method, deferred income tax assets and liabilities
124