LinkedIn 2015 Annual Report Download - page 73
Download and view the complete annual report
Please find page 73 of the 2015 LinkedIn annual report below. You can navigate through the pages in the report by either clicking on the pages listed below, or by using the keyword search tool below to find specific information within the annual report.-
 1
1 -
2
-
3
-
4
-
5
-
6
-
7
-
8
-
9
-
10
-
11
-
12
-
13
-
14
-
15
-
16
-
17
-
18
-
19
-
20
-
21
-
22
-
23
-
24
-
25
-
26
-
27
-
28
-
29
-
30
-
31
-
32
-
33
-
34
-
35
-
36
-
37
-
38
-
39
-
40
-
41
-
42
-
43
-
44
-
45
-
46
-
47
-
48
-
49
-
50
-
51
-
52
-
53
-
54
-
55
-
56
-
57
-
58
-
59
-
60
-
61
-
62
-
 63
63 -
 64
64 -
 65
65 -
 66
66 -
 67
67 -
 68
68 -
 69
69 -
 70
70 -
 71
71 -
 72
72 -
 73
73 -
 74
74 -
 75
75 -
 76
76 -
 77
77 -
 78
78 -
 79
79 -
 80
80 -
 81
81 -
 82
82 -
 83
83 -
84
-
85
-
86
-
87
-
88
-
89
-
90
-
91
-
92
-
93
-
94
-
95
-
96
-
97
-
98
-
99
-
100
-
101
-
102
-
103
-
104
-
105
-
106
-
107
-
108
-
109
-
110
-
111
-
112
-
113
-
114
-
115
-
116
-
117
-
118
-
119
-
120
-
121
-
122
-
123
-
124
-
125
-
126
-
127
-
128
-
129
-
130
-
131
-
132
-
133
-
134
-
135
-
136
-
137
-
138
-
139
-
140
-
141
-
142
-
143
 |
 |

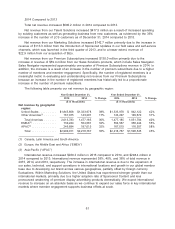
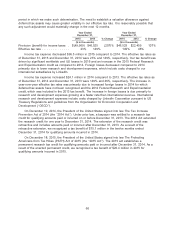
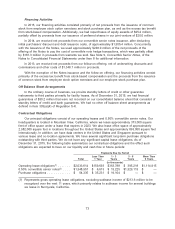
On May 14, 2015, we acquired Lynda.com. We believe that the acquisition of Lynda.com positions
us to be able to further expand on our long-term content strategy, and to realize our vision of building
the world’s first economic graph. The total purchase price paid for all of the outstanding equity interests
of Lynda.com was approximately $1.5 billion, subject to adjustment, which was paid in combination of
approximately 52% in cash and approximately 48% in shares of our Class A common stock.
We believe that our existing cash and cash equivalents and marketable securities balances,
together with cash generated from operations, will be sufficient to meet our working capital expenditure
requirements for at least the next 12 months.
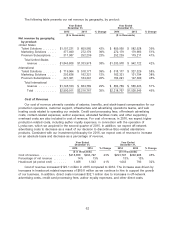
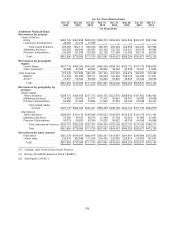
December 31, December 31,
2015 2014
(in thousands)
Consolidated Balance Sheet Data:
Cash and cash equivalents ................................. $ 546,237 $ 460,887
Marketable securities ..................................... $2,573,145 $2,982,422
Convertible senior notes, net ................................ $1,126,534 $1,081,553
Year Ended December 31,
2015 2014 2013
(in thousands)
Consolidated Statements of Cash Flows Data:
Cash flows provided by operating activities ............ $806,975 $ 568,951 $ 436,473
Cash flows used in investing activities ................ (792,077) (2,293,271) (1,357,545)
Cash flows provided by financing activities ............ 77,814 1,388,485 1,454,219
Effect of exchange rate changes on cash and cash
equivalents ................................. (7,362) (6,367) (466)
Change in cash and cash equivalents .............. $ 85,350 $ (342,202) $ 532,681
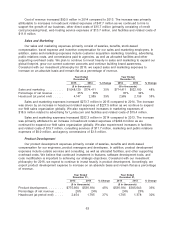
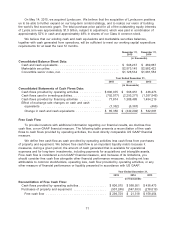
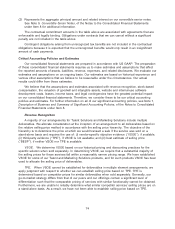
Free Cash Flow
To provide investors with additional information regarding our financial results, we disclose free
cash flow, a non-GAAP financial measure. The following table presents a reconciliation of free cash
flows to cash flows provided by operating activities, the most directly comparable US GAAP financial
measure.
We define free cash flow as cash provided by operating activities less cash flows from purchases
of property and equipment. We believe free cash flow is an important liquidity metric because it
measures, during a given period, the amount of cash generated that is available for operational
expenses and for long-term investments, including payments for acquisitions and intangible assets.
Free cash flow is considered a non-GAAP financial measure, and, because of its limitations, you
should consider free cash flow alongside other financial performance measures, including net loss
attributable to common stockholders, operating loss, cash flow provided by operating activities, or any
other measure of financial performance or liquidity presented in accordance with US GAAP.
Year Ended December 31,
2015 2014 2013
(in thousands)
Reconciliation of Free Cash Flow:
Cash flows provided by operating activities ............... $806,975 $ 568,951 $ 436,473
Purchases of property and equipment .................. (507,246) (547,633) (278,019)
Free cash flow ................................. $299,729 $ 21,318 $ 158,454
71