LinkedIn 2015 Annual Report Download - page 74
Download and view the complete annual report
Please find page 74 of the 2015 LinkedIn annual report below. You can navigate through the pages in the report by either clicking on the pages listed below, or by using the keyword search tool below to find specific information within the annual report.-
 1
1 -
2
-
3
-
4
-
5
-
6
-
7
-
8
-
9
-
10
-
11
-
12
-
13
-
14
-
15
-
16
-
17
-
18
-
19
-
20
-
21
-
22
-
23
-
24
-
25
-
26
-
27
-
28
-
29
-
30
-
31
-
32
-
33
-
34
-
35
-
36
-
37
-
38
-
39
-
40
-
41
-
42
-
43
-
44
-
45
-
46
-
47
-
48
-
49
-
50
-
51
-
52
-
53
-
54
-
55
-
56
-
57
-
58
-
59
-
60
-
61
-
62
-
63
-
 64
64 -
 65
65 -
 66
66 -
 67
67 -
 68
68 -
 69
69 -
 70
70 -
 71
71 -
 72
72 -
 73
73 -
 74
74 -
 75
75 -
 76
76 -
 77
77 -
 78
78 -
 79
79 -
 80
80 -
 81
81 -
 82
82 -
 83
83 -
 84
84 -
85
-
86
-
87
-
88
-
89
-
90
-
91
-
92
-
93
-
94
-
95
-
96
-
97
-
98
-
99
-
100
-
101
-
102
-
103
-
104
-
105
-
106
-
107
-
108
-
109
-
110
-
111
-
112
-
113
-
114
-
115
-
116
-
117
-
118
-
119
-
120
-
121
-
122
-
123
-
124
-
125
-
126
-
127
-
128
-
129
-
130
-
131
-
132
-
133
-
134
-
135
-
136
-
137
-
138
-
139
-
140
-
141
-
142
-
143
 |
 |
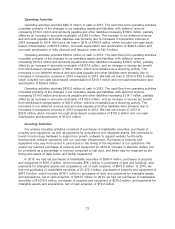
Operating Activities
Operating activities provided $807.0 million of cash in 2015. The cash flow from operating activities
consisted primarily of the changes in our operating assets and liabilities, with deferred revenue
increasing $144.0 million and accounts payable and other liabilities increasing $100.9 million, partially
offset by an increase in accounts receivable of $149.5 million. The increase in our deferred revenue
and accounts payable and other liabilities was primarily due to increases in transaction volumes in
2015 compared to 2014. We had a net loss in 2015 of $164.8 million, which included non-cash stock-
based compensation of $510.3 million, non-cash depreciation and amortization of $420.5 million and
non-cash amortization of debt discount and issuance costs of $45.6 million.
Operating activities provided $569.0 million of cash in 2014. The cash flow from operating activities
consisted primarily of the changes in our operating assets and liabilities, with deferred revenue
increasing $129.3 million and accounts payable and other liabilities increasing $150.0 million, partially
offset by an increase in accounts receivable of $137.6 million, and an increase in excess tax benefit
from stock-based compensation of $99.2 million, which is reclassified as a financing activity. The
increases in our deferred revenue and accounts payable and other liabilities were primarily due to
increases in transaction volumes in 2014 compared to 2013. We had net loss in 2014 of $15.3 million,
which included non-cash stock-based compensation of $319.1 million and non-cash depreciation and
amortization of $236.9 million.
Operating activities provided $436.5 million of cash in 2013. The cash flow from operating activities
consisted primarily of the changes in our operating assets and liabilities, with deferred revenue
increasing $134.5 million and accounts payable and other liabilities increasing $114.7 million, partially
offset by an increase in accounts receivable of $102.6 million, and an increase in excess tax benefit
from stock-based compensation of $43.8 million, which is reclassified as a financing activity. The
increases in our deferred revenue and accounts payable and other liabilities were primarily due to
increases in transaction volumes in 2013 compared to 2012. We had net income in 2013 of
$26.8 million, which included non-cash stock-based compensation of $193.9 million and non-cash
depreciation and amortization of $134.5 million.
Investing Activities
Our primary investing activities consisted of purchases of marketable securities, purchases of
property and equipment, as well as payments for acquisitions and intangible assets. We continued to
invest in technology hardware to support our growth, software to support website functionality
development, website operations and our corporate infrastructure. Purchases of property and
equipment may vary from period to period due to the timing of the expansion of our operations. We
expect our planned purchases of property and equipment for 2016 to increase in absolute dollars, but
be consistent as a percentage of revenue compared to last year, and these may be impacted by the
timing and extent of data center and facility expansions.
In 2015, we had net purchases of marketable securities of $386.4 million, purchases of property
and equipment of $507.2 million, which includes $58.1 million in purchases of land and buildings, and
payments for intangible assets and acquisitions, net of cash acquired, of $677.8 million. In 2014, we
had net purchases of marketable securities of $1,472.3 million, purchases of property and equipment of
$547.6 million, which includes $178.7 million in purchases of land, and payments for intangible assets
and acquisitions, net of cash acquired, of $253.5 million. In 2013, we had net purchases of marketable
securities of $1,055.4 million, purchases of property and equipment of $278.0 million, and payments for
intangible assets and acquisitions, net of cash acquired, of $19.2 million.
72