LinkedIn 2015 Annual Report Download - page 119
Download and view the complete annual report
Please find page 119 of the 2015 LinkedIn annual report below. You can navigate through the pages in the report by either clicking on the pages listed below, or by using the keyword search tool below to find specific information within the annual report.-
 1
1 -
2
-
3
-
4
-
5
-
6
-
7
-
8
-
9
-
10
-
11
-
12
-
13
-
14
-
15
-
16
-
17
-
18
-
19
-
20
-
21
-
22
-
23
-
24
-
25
-
26
-
27
-
28
-
29
-
30
-
31
-
32
-
33
-
34
-
35
-
36
-
37
-
38
-
39
-
40
-
41
-
42
-
43
-
44
-
45
-
46
-
47
-
48
-
49
-
50
-
51
-
52
-
53
-
54
-
55
-
56
-
57
-
58
-
59
-
60
-
61
-
62
-
63
-
64
-
65
-
66
-
67
-
68
-
69
-
70
-
71
-
72
-
73
-
74
-
75
-
76
-
77
-
78
-
79
-
80
-
81
-
82
-
83
-
84
-
85
-
86
-
87
-
88
-
89
-
90
-
91
-
92
-
93
-
94
-
95
-
96
-
97
-
98
-
99
-
100
-
101
-
102
-
103
-
104
-
105
-
106
-
107
-
108
-
 109
109 -
 110
110 -
 111
111 -
 112
112 -
 113
113 -
 114
114 -
 115
115 -
 116
116 -
 117
117 -
 118
118 -
 119
119 -
 120
120 -
 121
121 -
 122
122 -
 123
123 -
 124
124 -
 125
125 -
 126
126 -
 127
127 -
 128
128 -
 129
129 -
130
-
131
-
132
-
133
-
134
-
135
-
136
-
137
-
138
-
139
-
140
-
141
-
142
-
143
 |
 |

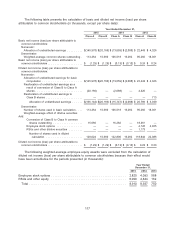
The following table presents the calculation of basic and diluted net income (loss) per share
attributable to common stockholders (in thousands, except per share data):
Year Ended December 31,
2015 2014 2013
Class A Class B Class A Class B Class A Class B
Basic net income (loss) per share attributable to
common stockholders:
Numerator:
Allocation of undistributed earnings ......... $(145,978) $(20,166) $ (13,659) $ (2,088) $ 22,443 $ 4,326
Denominator:
Weighted-average common shares outstanding . 113,364 15,660 106,518 16,282 95,282 18,361
Basic net income (loss) per share attributable to
common stockholders .................... $ (1.29) $ (1.29) $ (0.13) $ (0.13) $ 0.24 $ 0.24
Diluted net income (loss) per share attributable to
common stockholders:
Numerator:
Allocation of undistributed earnings for basic
computation ....................... $(145,978) $(20,166) $ (13,659) $ (2,088) $ 22,443 $ 4,326
Reallocation of undistributed earnings as a
result of conversion of Class B to Class A
shares ........................... (20,166) — (2,088) — 4,326 —
Reallocation of undistributed earnings to
Class B shares ..................... — — — — — 713
Allocation of undistributed earnings ...... $(166,144) $(20,166) $ (15,747) $ (2,088) $ 26,769 $ 5,039
Denominator:
Number of shares used in basic calculation .... 113,364 15,660 106,518 16,282 95,282 18,361
Weighted-average effect of dilutive securities
Add:
Conversion of Class B to Class A common
shares outstanding ................. 15,660 — 16,282 — 18,361 —
Employee stock options ............... — — — — 4,128 4,025
RSUs and other dilutive securities ........ — — — — 1,173 —
Number of shares used in diluted
calculation ..................... 129,024 15,660 122,800 16,282 118,944 22,386
Diluted net income (loss) per share attributable to
common stockholders .................... $ (1.29) $ (1.29) $ (0.13) $ (0.13) $ 0.23 $ 0.23
The following weighted-average employee equity awards were excluded from the calculation of
diluted net income (loss) per share attributable to common stockholders because their effect would
have been anti-dilutive for the periods presented (in thousands):
Year Ended
December 31,
2015 2014 2013
Employee stock options ......................................... 2,820 4,093 588
RSUs and other equity ......................................... 6,090 4,844 162
Total ..................................................... 8,910 8,937 750
117