LinkedIn 2015 Annual Report Download - page 59
Download and view the complete annual report
Please find page 59 of the 2015 LinkedIn annual report below. You can navigate through the pages in the report by either clicking on the pages listed below, or by using the keyword search tool below to find specific information within the annual report.-
 1
1 -
2
-
3
-
4
-
5
-
6
-
7
-
8
-
9
-
10
-
11
-
12
-
13
-
14
-
15
-
16
-
17
-
18
-
19
-
20
-
21
-
22
-
23
-
24
-
25
-
26
-
27
-
28
-
29
-
30
-
31
-
32
-
33
-
34
-
35
-
36
-
37
-
38
-
39
-
40
-
41
-
42
-
43
-
44
-
45
-
46
-
47
-
48
-
 49
49 -
 50
50 -
 51
51 -
 52
52 -
 53
53 -
 54
54 -
 55
55 -
 56
56 -
 57
57 -
 58
58 -
 59
59 -
 60
60 -
 61
61 -
 62
62 -
 63
63 -
 64
64 -
 65
65 -
 66
66 -
 67
67 -
 68
68 -
 69
69 -
70
-
71
-
72
-
73
-
74
-
75
-
76
-
77
-
78
-
79
-
80
-
81
-
82
-
83
-
84
-
85
-
86
-
87
-
88
-
89
-
90
-
91
-
92
-
93
-
94
-
95
-
96
-
97
-
98
-
99
-
100
-
101
-
102
-
103
-
104
-
105
-
106
-
107
-
108
-
109
-
110
-
111
-
112
-
113
-
114
-
115
-
116
-
117
-
118
-
119
-
120
-
121
-
122
-
123
-
124
-
125
-
126
-
127
-
128
-
129
-
130
-
131
-
132
-
133
-
134
-
135
-
136
-
137
-
138
-
139
-
140
-
141
-
142
-
143
 |
 |

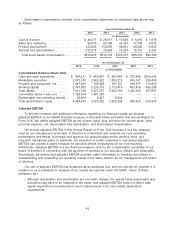
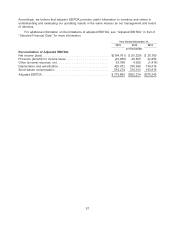
Accordingly, we believe that adjusted EBITDA provides useful information to investors and others in
understanding and evaluating our operating results in the same manner as our management and board
of directors.
For additional information on the limitations of adjusted EBITDA, see ‘‘Adjusted EBITDA’’ in Item 6
‘‘Selected Financial Data’’ for more information.
Year Ended December 31,
2015 2014 2013
(in thousands)
Reconciliation of Adjusted EBITDA:
Net income (loss) .................................... $(164,761) $ (15,320) $ 26,769
Provision (benefit) for income taxes ....................... (49,969) 46,525 22,459
Other (income) expense, net ............................ 63,788 4,930 (1,416)
Depreciation and amortization ........................... 420,472 236,946 134,516
Stock-based compensation ............................. 510,274 319,133 193,915
Adjusted EBITDA .................................... $779,804 $592,214 $376,243
57