Kia 2013 Annual Report Download - page 61
Download and view the complete annual report
Please find page 61 of the 2013 Kia annual report below. You can navigate through the pages in the report by either clicking on the pages listed below, or by using the keyword search tool below to find specific information within the annual report.-
 1
1 -
2
-
3
-
4
-
5
-
6
-
7
-
8
-
9
-
10
-
11
-
12
-
13
-
14
-
15
-
16
-
17
-
18
-
19
-
20
-
21
-
22
-
23
-
24
-
25
-
26
-
27
-
28
-
29
-
30
-
31
-
32
-
33
-
34
-
35
-
36
-
37
-
38
-
39
-
40
-
41
-
42
-
43
-
44
-
45
-
46
-
47
-
48
-
49
-
50
-
 51
51 -
 52
52 -
 53
53 -
 54
54 -
 55
55 -
 56
56 -
 57
57 -
 58
58 -
 59
59 -
 60
60 -
 61
61 -
 62
62 -
 63
63 -
 64
64 -
 65
65 -
 66
66 -
 67
67 -
 68
68
 |
 |
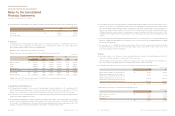
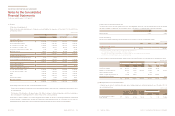
For the years ended December 31, 2013 and 2012
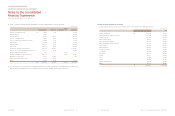
The Company measured the fair value of financial instruments as follows:
- The fair value of available-for-sale financial assets traded within the market is measured at the closing bid price quoted at the end of
the reporting period.
- The fair value of the derivatives is the present value of the difference between contractual forward price and future forward price
discounted during the remaining period of the contract, from present to contractual maturity.
The fair value of current receivables is close to their carrying amounts. In addition, the fair value of other financial instruments is determined
as the present value of estimated future cash flows discounted at the current market interest rate. As of December 31, 2013, there isn’t
any significant business climate and economic environment changes affecting the fair value of financial assets and liabilities.
(ii) Interest rates used for determining fair value
The interest rates used to discount estimated cash flows, when applicable, are based on the government yield curve at the reporting
date plus an adequate credit spread. The interest rates used as of December 31, 2013 and 2012 are summarized as follows:
Debts and bonds 2.93% 3.08%
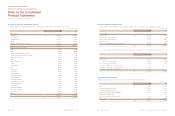
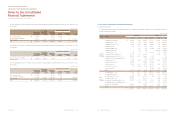
(iii) Fair value hierarchy
Fair value measurement classified by fair value hierarchy as of December 31, 2013 are summarized as follows:
Available-for-sale financial assets:
Marketable securities ₩853,061 - - 853,061
(In millions of won)
(*) Financial assets and liabilities carried at fair value by each valuation method are defined as follows:
- Level 1: quoted prices (unadjusted) in active markets for identical assets or liabilities
- Level 2: inputs other than quoted prices included within Level 1 that are observable for the asset or liability, either directly or in indirectly
- Level 3: input for the asset or liability that are not based on observable market data
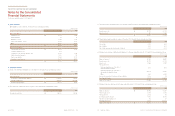
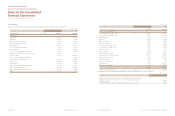
(f) Income and expense by financial instruments category for the years ended December 31, 2013 and 2012 are summarized as follows:
Loans and receivables ₩206,961 25,078 - 197,688 46,142 -
Available-for- sale financial assets 223,371 15,356 (143,399) 64,647 202 127,042
Held-to-maturity investments 901 196 - 895 - -
Liabilities recognized by amortized cost 24,042 98,812 - 139,565 164,801 -
Derivative financial instruments - - - - - 5,543
₩455,275 139,442 (143,399) 402,795 211,145 132,585
(In millions of won)
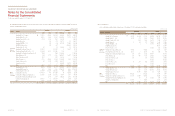
(g) Offsetting financial assets and financial liabilities
(i) Financial assets subject to offsetting, enforceable master netting arrangements and similar agreements as of December 31, 2013
are summarized as follows:
Accounts and notes receivables -
trade, and other ₩512,720 397,744 114,976 74 1,114 113,788
(In millions of won)
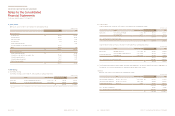
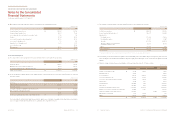
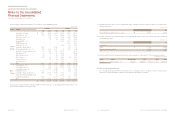
(e) Fair value
(i) Fair value and carrying amount
Details of fair value and carrying amount of financial assets and liabilities by category as of December 31, 2013 and 2012 are
summarized as follows:
Loans and receivables:
Cash and cash equivalents ₩2,311,264 2,311,264 1,903,309 1,903,309
Short-term financial instruments 4,035,379 4,035,379 2,367,230 2,367,230
Account and notes receivable - trade 2,072,818 2,072,818 1,801,731 1,801,731
Account and note receivable - other 468,210 468,210 485,696 485,696
Long-term account and notes receivable - trade 1,662 1,662 2,675 2,675
Other financial assets 640,517 640,517 481,724 481,724
₩9,529,850 9,529,850 7,042,365 7,042,365
Available-for-sale financial assets:
Short-term available-for-sale financial assets ₩8,000 8,000 - -
Long-term available-for-sale financial assets 1,237,107 1,237,107 1,606,358 1,606,358
₩1,245,107 1,245,107 1,606,358 1,606,358
Held-to-maturity investments:
Held-to-maturity investments ₩- - 18,755 18,755
Liabilities recognized by amortized cost:
Accounts and notes payable - trade ₩5,192,589 5,192,589 4,998,445 4,998,445
Accounts and notes payable - other 1,763,692 1,763,692 1,713,988 1,713,988
Bonds 1,508,184 1,450,395 1,620,707 1,652,202
Debt 1,813,586 1,839,613 2,233,501 2,228,179
Financial lease liabilities 17,382 17,382 21,871 21,871
Other financial liabilities 1,206,895 1,206,895 1,032,556 1,032,556
₩11,502,328 11,470,566 11,621,068 11,647,241
(In millions of won)