Kia 2013 Annual Report Download - page 37
Download and view the complete annual report
Please find page 37 of the 2013 Kia annual report below. You can navigate through the pages in the report by either clicking on the pages listed below, or by using the keyword search tool below to find specific information within the annual report.-
 1
1 -
2
-
3
-
4
-
5
-
6
-
7
-
8
-
9
-
10
-
11
-
12
-
13
-
14
-
15
-
16
-
17
-
18
-
19
-
20
-
21
-
22
-
23
-
24
-
25
-
26
-
 27
27 -
 28
28 -
 29
29 -
 30
30 -
 31
31 -
 32
32 -
 33
33 -
 34
34 -
 35
35 -
 36
36 -
 37
37 -
 38
38 -
 39
39 -
 40
40 -
 41
41 -
 42
42 -
 43
43 -
 44
44 -
 45
45 -
 46
46 -
 47
47 -
48
-
49
-
50
-
51
-
52
-
53
-
54
-
55
-
56
-
57
-
58
-
59
-
60
-
61
-
62
-
63
-
64
-
65
-
66
-
67
-
68
 |
 |
Note
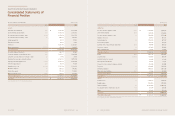
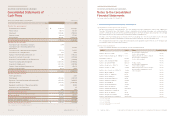
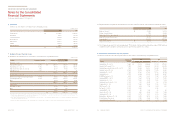
Cash flows from operating activities
Cash generated from operations 28 ₩5,051,324 5,153,910
Interest received 189,032 136,171
Interest paid (106,408) (156,640)
Dividends received 430,336 377,337
Income tax paid (787,691) (1,165,353)
Net cash provided by operating activities 4,776,593 4,345,425
Cash flows from investing activities
Proceeds from sale of investments in associates 7,266 -
Proceeds from sale of long-term available-for-sale
financial assets - 123,397
Proceeds from sale of property, plant and equipment 157,714 122,050
Proceeds from sale of intangible assets 610 2,877
Purchase of short-term financial instruments, net (1,548,149) (737,230)
Acquisition of investments in associates (89,200) (147,299)
Acquisition of long-term available-for-sale financial assets (24) (273,669)
Acquisition of property, plant and equipment (1,192,372) (1,574,649)
Acquisition of intangible assets (551,550) (326,768)
Purchase of long-term financial instruments, net (355,387) (37,957)
Collection of loans and others 57,152 6,671
Net cash used in investing activities (3,513,940) (2,842,577)
Cash flows from financing activities
Paid-in-capital increase - 9,407
Dividends paid (263,240) (242,167)
Repayment of short-term borrowings and long-term debt (421,251) (464,822)
Repayment of bonds (100,000) (1,108,143)
Repayment of current portion of financial lease liabilities (5,860) (5,546)
Acquisition of non-controlling interests - (6)
Cash flows from other financing activities (856) 1,163
Net cash used in financing activities (791,207) (1,810,114)
Impact on foreign currency exchange rates on cash
and cash equivalents (63,491) (93,594)
Net increase (decrease) in cash and cash equivalents 407,955 (400,860)
Cash and cash equivalents at January 1 1,903,309 2,304,169
Cash and cash equivalents at December 31 ₩2,311,264 1,903,309
See accompanying notes to the consolidated financial statements.
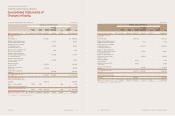
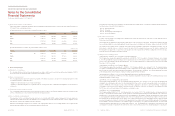
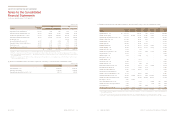
Kia Motors America, Inc. (KMA) U.S.A. Exclusive importer and distributor
of motor vehicles and parts 100.00%
Kia Motors Manufacturing Georgia, Inc. (KMMG)(*1) U.S.A. Manufacturing and sale of vehicles and parts 100.00%
Kia Canada Inc. (KCI)(*2) Canada Exclusive importer and distributor
of motor vehicles and parts 100.00%
Kia Motors Deutschland GmbH (KMD) Germany ”100.00%
Kia Motors Europe GmbH (KME) Germany Holding company 100.00%
Kia Motors Polska Sp.z.o.o. (KMP)(*3) Poland Exclusive importer and distributor
of motor vehicles and parts 100.00%
Kia Motors Slovakia s.r.o. (KMS) Slovakia Manufacturing and sale of vehicles and parts 100.00%
Kia Motors Sales Slovensko s.r.o. (KMSs)(*4) Slovakia Exclusive importer and distributorof motor
vehicles and parts 100.00%
Kia Motors Belgium (KMB)(*4) Belgium ”100.00%
Kia Motors Czech s.r.o. (KMCZ)(*4) Czech ”100.00%
Kia Motors UK Ltd. (KMUK)(*4) England ”100.00%
Kia Motors Austria GmbH (KMAS)(*4) Austria ”100.00%
Kia Motors Hungary K.f.t (KMH)(*4) Hungary ”100.00%
Kia Motors Iberia (KMIB)(*4) Spain ”100.00%
Kia Motors Sweden AB (KMSW)(*4) Sweden ”100.00%
Kia Motors France SAS (KMF)(*4) France ”100.00%
Kia Motors Nederland BV (KMNL)(*4) Netherlands ”100.00%
Kia Motors Company Italy S.r.l (KMIT)(*4) Italy ”100.00%
Kia Motors Russia LLC (KMR)(*5) Russia ”100.00%
Kia Motors Australia Pty Ltd. (KMAU) Australia ”100.00%
Kia Motors New Zealand Pty Ltd. (KMNZ)(*6) New Zealand ”100.00%
For the years ended December 31, 2013 and 2012 (In millions of won)
For the years ended December 31, 2013 and 2012
1. General Description of Parent Company and Subsidiaries
(a) Organization and description of the Company
Kia Motors Corporation (the “Parent Company”), one of the leading motor vehicle manufacturers in Korea, was established in
December 1944 under the laws of the Republic of Korea to manufacture and sell a range of passenger cars, recreational vehicles
and other commercial vehicles in the domestic and international markets. The Parent Company owns and operates three principal
automobile production sites: the Sohari factory, the Hwasung factory and the Kwangju factory.
The shares of the Parent Company have been listed on the Korea Exchange since 1973. As of December 31, 2013, the Parent
Company’s largest shareholder is Hyundai Motor Company, which holds 33.88 percent of the Parent Company’s stock.
The consolidated financial statements comprise the Parent Company and its subsidiaries (together referred to as the “Company”) and
the Company’s interest in associates and joint ventures.
(b) Consolidated subsidiaries
Details of consolidated subsidiaries as of December 31, 2013 are summarized as follows:
(*1) 100.00% owned by KMA
(*2) 17.47% owned by KMA
(*3) 100.00% owned by KMD
(*4) 100.00% owned by KME
(*5) 80.00% owned by KME and 20.00% owned by KMD
(*6) 100.00% owned by KMAU
•