Kia 2013 Annual Report Download - page 58
Download and view the complete annual report
Please find page 58 of the 2013 Kia annual report below. You can navigate through the pages in the report by either clicking on the pages listed below, or by using the keyword search tool below to find specific information within the annual report.-
 1
1 -
2
-
3
-
4
-
5
-
6
-
7
-
8
-
9
-
10
-
11
-
12
-
13
-
14
-
15
-
16
-
17
-
18
-
19
-
20
-
21
-
22
-
23
-
24
-
25
-
26
-
27
-
28
-
29
-
30
-
31
-
32
-
33
-
34
-
35
-
36
-
37
-
38
-
39
-
40
-
41
-
42
-
43
-
44
-
45
-
46
-
47
-
 48
48 -
 49
49 -
 50
50 -
 51
51 -
 52
52 -
 53
53 -
 54
54 -
 55
55 -
 56
56 -
 57
57 -
 58
58 -
 59
59 -
 60
60 -
 61
61 -
 62
62 -
 63
63 -
 64
64 -
 65
65 -
 66
66 -
 67
67 -
 68
68
 |
 |

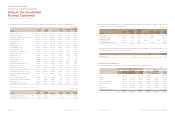
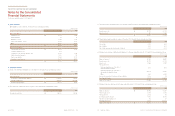
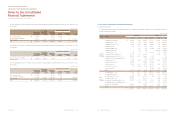
For the years ended December 31, 2013 and 2012
28.
Cash Flows
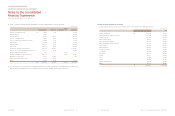
(a) Details of cash flows from operating for the years ended December 31, 2013 and 2012 are summarized as follows:
Profit for the year ₩3,817,059 3,864,704
Adjustments for:
Depreciation 839,074 752,120
Amortization 362,250 311,724
Other long term employee benefits 46,376 28,812
Retirement and severance benefits 252,361 212,326
Warranty expenses 1,050,494 1,040,461
Loss on foreign currency translations 27,026 20,718
Interest expense 89,673 156,808
Loss on sale of property, plant and equipment 49,100 34,196
Impairment loss of available-for-sale financial assets 15,355 -
Income tax expense 1,011,517 1,299,352
Loss on scrap and impairment of inventory - 23,568
Gain on foreign currency translations (46,651) (115,695)
Interest income (172,623) (168,957)
Dividends income (11,049) (5,634)
Gain on sale of property, plant and equipment (10,990) (17,501)
Gain on investment in associates, net (1,319,585) (1,414,080)
Gain on sale of available-for-sale financial assets (212,322) (59,013)
Others (24,705) 10,179
(In millions of won)
1,945,301 2,109,384
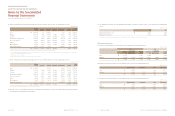
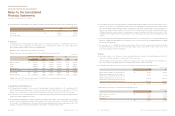
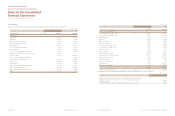
Changes in assets and liabilities:
Accounts and notes receivable - trade ₩(273,770) 365,104
Accounts and notes receivable - other 22,129 (59,962)
Advance payments 36,971 (13,049)
Inventories (80,758) 50,682
Other current assets (14,988) (17,841)
Other non-current assets 4,119 4,874
Accounts and notes payable - trade 189,659 173,558
Accounts and notes payable - other 119,992 (28,407)
Advances received 9,519 4,416
Accrued expenses 204,951 119,511
Payment of warranty expenses (835,862) (830,845)
Payment of long-term employee benefits (35,112) (12,344)
Payment of retirement benefits (14,947) (423,445)
Other current liabilities (13,402) (1,218)
Transfer of retirement benefit (1,999) 214
Benefit plan assets (8,845) (238,997)
Other non-current liabilities (18,693) 87,571
(711,036) (820,178)
Cash generated from operations ₩5,051,324 5,153,910
(b) Significant non-cash investing and financing activities for the year ended December 31, 2013 are as follows:
Change in advances received in connection to disposal of property, plant and equipment ₩(69,937)
Change in accounts and notes payable - other in connection to acquisition of property,
plant and equipment (62,599)
Reclassification from investments in available-for-sale financial assets to associates 372,847
(In millions of won)
(In millions of won)