Kia 2013 Annual Report Download - page 57
Download and view the complete annual report
Please find page 57 of the 2013 Kia annual report below. You can navigate through the pages in the report by either clicking on the pages listed below, or by using the keyword search tool below to find specific information within the annual report.-
 1
1 -
2
-
3
-
4
-
5
-
6
-
7
-
8
-
9
-
10
-
11
-
12
-
13
-
14
-
15
-
16
-
17
-
18
-
19
-
20
-
21
-
22
-
23
-
24
-
25
-
26
-
27
-
28
-
29
-
30
-
31
-
32
-
33
-
34
-
35
-
36
-
37
-
38
-
39
-
40
-
41
-
42
-
43
-
44
-
45
-
46
-
 47
47 -
 48
48 -
 49
49 -
 50
50 -
 51
51 -
 52
52 -
 53
53 -
 54
54 -
 55
55 -
 56
56 -
 57
57 -
 58
58 -
 59
59 -
 60
60 -
 61
61 -
 62
62 -
 63
63 -
 64
64 -
 65
65 -
 66
66 -
 67
67 -
68
 |
 |

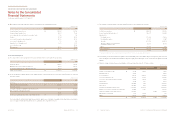
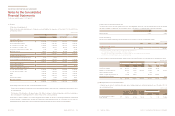
For the years ended December 31, 2013 and 2012
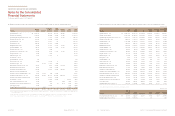
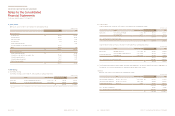
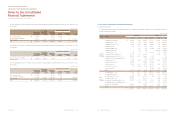
(f) Details of changes in deferred tax assets and liabilities for the year ended December 31, 2012 are as follows:
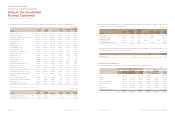
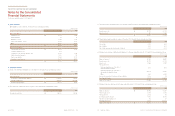
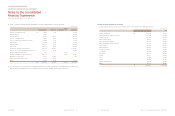
(g) As of December 31, 2013 the amounts of total temporary differences related to investments of subsidiaries and associates which
deferred tax assets and liabilities were not recognized, are ₩ 443,672 million and ₩ 2,121,689 million, respectively.
Allowance for doubtful accounts ₩18,853 1,332 - 20,185
Bad debts write-off 59,880 - - 59,880
Accrued expenses 139,702 105,491 - 245,193
Provision of warranty for sale 291,501 30,269 - 321,770
Provision of other long-term employee benefits 47,746 6,096 - 53,842
Annual leaves 20,498 2,288 - 22,786
Revaluated land (372,219) 5,351 - (366,868)
Depreciation (325,292) 53,450 - (271,842)
Investment in subsidiaries and associates (850,040) (346,312) - (1,196,352)
Gains/Losses on sales of investment assets and others (97,031) 20,188 - (76,843)
Valuation of derivative instruments 1,770 - (1,770) -
Valuation of available-for-sale financial assets (136,181) - (40,560) (176,741)
Operating loss carryforward 36,576 (34,186) - 2,390
Carryforwards of unused tax credits 119,012 (119,012) - -
Others 82,855 23,204 - 106,059
₩(962,370) (251,841) (42,330) (1,256,541)
(In millions of won)
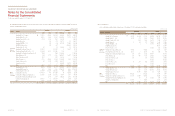
27.
Classification of Expenses by Nature
Details of expenses by nature for the years ended December 31, 2013 and 2012 are summarized as follows:
Changes in inventories ₩(151,297) 110,551
Raw material and merchandise consumed 31,711,333 31,114,554
Employee benefits 3,910,451 3,635,792
Other employee benefits 626,206 609,717
Depreciation and amortization 1,201,324 1,063,844
Overseas marketing and export expenses 1,061,139 1,113,871
Sales promotion 795,287 1,010,506
Warranty expenses 1,050,494 1,040,461
Commissions and fees 1,006,899 709,494
Test expenses 732,434 733,759
Advertising 1,227,916 1,282,854
Freight 326,120 442,634
Rent 59,824 57,547
Utilities 303,557 291,391
Repairs and maintenance 128,218 126,126
Others 430,892 377,581
₩44,420,797 43,720,682
(In millions of won)