Kia 2013 Annual Report Download - page 4
Download and view the complete annual report
Please find page 4 of the 2013 Kia annual report below. You can navigate through the pages in the report by either clicking on the pages listed below, or by using the keyword search tool below to find specific information within the annual report.-
 1
1 -
 2
2 -
 3
3 -
 4
4 -
 5
5 -
 6
6 -
 7
7 -
 8
8 -
 9
9 -
 10
10 -
 11
11 -
 12
12 -
 13
13 -
 14
14 -
 15
15 -
16
-
17
-
18
-
19
-
20
-
21
-
22
-
23
-
24
-
25
-
26
-
27
-
28
-
29
-
30
-
31
-
32
-
33
-
34
-
35
-
36
-
37
-
38
-
39
-
40
-
41
-
42
-
43
-
44
-
45
-
46
-
47
-
48
-
49
-
50
-
51
-
52
-
53
-
54
-
55
-
56
-
57
-
58
-
59
-
60
-
61
-
62
-
63
-
64
-
65
-
66
-
67
-
68
 |
 |

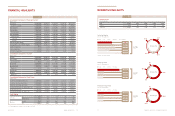
* Consolidated data based on K-GAAP for 2009 and K-IFRS for 2010-2013
•
(KRW in millions)
Total Assets 36,182,040 32,398,314 30,255,179 26,275,144 25,962,876
Cash Items (Liquidity) 6,346,643 4,270,539 3,934,169 2,914,146 2,792,286
Current Assets 13,472,386 11,139,430 11,075,187 9,763,671 11,208,990
Total Liabilities 15,927,245 15,550,252 16,745,469 16,027,027 18,658,782
Short-term Debt 1,640,958 1,404,947 3,104,071 3,585,210 3,752,210
Current Liabilities 10,806,238 10,000,239 11,421,924 11,627,539 12,910,209
Long-term Debt 1,698,194 2,471,132 2,503,230 2,755,446 6,192,950
Total Debt 3,339,152 3,876,079 5,607,300 6,340,656 9,945,160
Net Debt (3,007,491) (394,460) 1,673,132 3,426,510 7,152,874
Total Stockholders’ Equity 20,254,795 16,848,062 13,509,709 10,248,117 7,304,094
Total Liabilities & Stockholders’ Equity 36,182,040 32,398,314 30,255,179 26,275,144 25,962,876
Liability-to-Equity Ratio 78.6% 92.3% 124.0% 156.4% 255.5%
Debt-to-Equity Ratio 16.5% 23.0% 41.5% 61.9% 136.2%
Net Debt-to-Equity Ratio (14.8%) (2.3%) 12.4% 33.4% 97.9%
(KRW in millions)
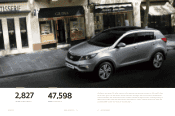
Revenue 47,597,897 47,242,933 43,190,942 35,826,955 29,257,392
Cost of Sales 37,511,941 36,536,005 33,138,961 27,905,367 22,769,058
Cost of Sales (%) 78.8% 77.3% 76.7% 77.9% 77.8%
Gross Profit 10,085,956 10,706,928 10,051,981 7,921,588 6,676,148
Operating Profit 3,177,100 3,522,251 3,499,088 2,369,852 1,195,206
Margin (%) 6.7% 7.5% 8.1% 6.6% 4.1%
Pretax Profit 4,828,576 5,164,056 4,721,650 3,323,048 1,220,714
Net Profit 3,817,059 3,864,704 3,519,236 2,698,331 1,020,632
Margin (%) 8.0% 8.2% 8.1% 7.5% 3.5%
(KRW in millions)
Cash Flows from Operating Activities 4,776,593 4,345,425 4,745,189 5,272,537 4,306,926
Cash Flows from Investing Activities (3,513,940) (2,842,577) (2,630,548) (2,296,053) (1,739,819)
Cash Flows from Financing Activities (791,207) (1,810,114) (1,440,956) (3,343,298) (1,796,307)
Cash and Cash Equivalents, Beginning of Year 1,903,309 2,304,169 1,615,879 2,001,225 1,268,631
Net Increase (Decrease) 407,955 (400,860) 688,290 (385,346) 1,032,510
Cash and Cash Equivalents, End of Year 2,311,264 1,903,309 2,304,169 1,615,879 2,301,141
Domestic KIS AA+ AA+ AA AA AA-
KOREA Rating AA+ AA+ AA AA AA-
Overseas Moody’s Baa1 Baa1 Baa2 Baa3 Baa3
S&P BBB+ BBB+ BBB BBB BBB-
(Unit: Thousand units)
Total 2,746 2,709 2,478 2,088 1,651
Korea 458 481 492 483 411
Overseas 2,289 2,228 1,986 1,605 1,239
(Unit: % / Thousand units)
* Europe = EU+EFTA countries
TOTAL
Korea US China Europe* Rest of World
(Unit: % / Thousand units)
TOTAL
Korea US China Slovakia
(Unit: %, Thousand units)
TOTAL
Korea US China Slovakia