Kia 2013 Annual Report Download - page 50
Download and view the complete annual report
Please find page 50 of the 2013 Kia annual report below. You can navigate through the pages in the report by either clicking on the pages listed below, or by using the keyword search tool below to find specific information within the annual report.
For the years ended December 31, 2013 and 2012
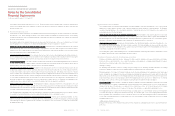
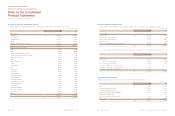
(b) Goodwill is allocated to each CGU (Cash Generating Unit) that is expected to benefit from each operating unit. The Company
estimated the recoverable amount of CGU as its value in use calculated by discounting the future cash flows to be generated on the
basis of business plan approved by CEO in five years. Cash flows expected to be generated after five years were estimated within the
scope of not to exceed long term average growth rate of industry. No impairment loss is recognized as a result of the impairment tests
in 2013 and 2012.
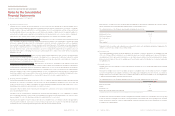
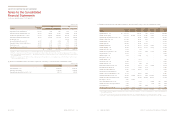
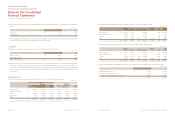
(e) Land and buildings held for the purpose of earning rentals are classified as investment property. In addition, the fair value of investment
property doesn’t differ from its book value significantly as of December 31, 2013.
(d) The amount recognized in profit or loss from investment property for the years ended December 31, 2013 and 2012 are summarized as
follows:
Rental income ₩5,295 5,770
Operating expense 728 1,930
(In millions of won)
11.
Goodwill
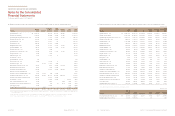
(a) Changes in goodwill for the years ended December 31, 2013 and 2012 are summarized as follows:
Balance at January 1 ₩36,188 36,287
Other increase (decrease) 102 (99)
Balance at December 31 ₩36,290 36,188
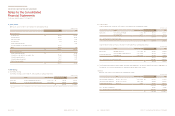
(In millions of won)
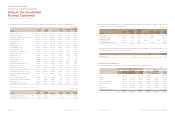
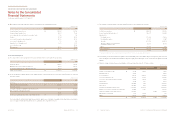
Development costs ₩3,032,179 (1,508,226) 1,523,953 2,523,333 (1,179,776) 1,343,557
Industrial property rights 71,022 (49,605) 21,417 68,582 (38,558) 30,024
Software 194,581 (133,344) 61,237 167,305 (113,439) 53,866
Membership(*) 70,245 (10,534) 59,711 64,127 (8,322) 55,805
Other 14,163 (1,032) 13,131 5,980 (1,419) 4,561
₩3,382,190 (1,702,741) 1,679,449 2,829,327 (1,341,514) 1,487,813
(In millions of won)
12.
Intangible Assets
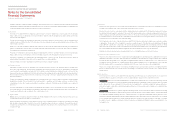
(a) Details of intangible assets except for goodwill as of December 31, 2013 and 2012 are summarized as follows:
(*) Membership has indefinite useful lives and it has been tested for impairment annually by comparing its recoverable amount to its carrying amount.
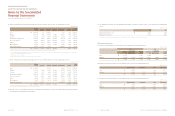
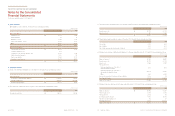
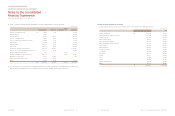
(b) Details of changes in intangible assets for the year ended December 31, 2013 are summarized as follows:
(In millions of won)
Development costs ₩1,343,557 509,139 - (328,685) - (58) 1,523,953
Industrial property rights 30,024 3,112 - (11,753) - 34 21,417
Software 53,866 29,076 - (21,481) - (224) 61,237
Other 60,366 16,296 (720) (331) (2,672) (97) 72,842
₩1,487,813 557,623 (720) (362,250) (2,672) (345) 1,679,449
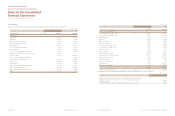
(c) Details of changes in intangible assets for the year ended December 31, 2012 are summarized as follows:
(In millions of won)
Development costs ₩1,327,275 293,340 - (276,414) - (644) 1,343,557
Industrial property rights 42,749 2,412 - (13,117) - (2,020) 30,024
Software 50,438 27,312 (188) (21,857) - (1,839) 53,866
Other 60,528 5,097 (2,812) (336) (2,910) 799 60,366
₩1,480,990 328,161 (3,000) (311,724) (2,910) (3,704) 1,487,813
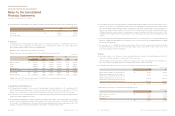
Capitalized development costs ₩509,139 293,340
Test expenses (manufacturing costs) 169,164 173,689
Test expenses (selling and administrative expenses) 563,270 560,070
₩1,241,573 1,027,099
(In millions of won)
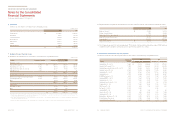
(d) Details of research and development expenditures for the years ended December 31, 2013 and 2012 are summarized as follows:


