Kia 2013 Annual Report Download - page 35
Download and view the complete annual report
Please find page 35 of the 2013 Kia annual report below. You can navigate through the pages in the report by either clicking on the pages listed below, or by using the keyword search tool below to find specific information within the annual report.-
 1
1 -
2
-
3
-
4
-
5
-
6
-
7
-
8
-
9
-
10
-
11
-
12
-
13
-
14
-
15
-
16
-
17
-
18
-
19
-
20
-
21
-
22
-
23
-
24
-
 25
25 -
 26
26 -
 27
27 -
 28
28 -
 29
29 -
 30
30 -
 31
31 -
 32
32 -
 33
33 -
 34
34 -
 35
35 -
 36
36 -
 37
37 -
 38
38 -
 39
39 -
 40
40 -
 41
41 -
 42
42 -
 43
43 -
 44
44 -
 45
45 -
46
-
47
-
48
-
49
-
50
-
51
-
52
-
53
-
54
-
55
-
56
-
57
-
58
-
59
-
60
-
61
-
62
-
63
-
64
-
65
-
66
-
67
-
68
 |
 |

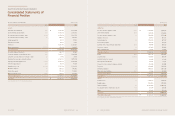
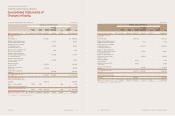
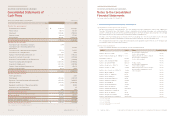
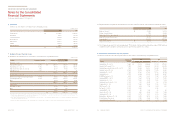
See accompanying notes to the consolidated financial statements.
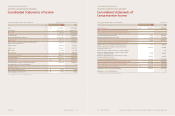
Profit for the year ₩3,817,059 3,864,704
Other comprehensive income (loss) for the year (net of tax):
Items that will not be reclassified subsequently to profit or loss:
Defined benefit plan remeasurements 74,281 (155,817)
Change in remeasurements of associates 10,688 (28,394)
Total items that will not be reclassified subsequently to profit or loss 84,969 (184,211)
Items that may be reclassified subsequently to profit or loss:
Change in fair value of available-for-sale financial assets 5,902 179,405
Change in fair value of available-for-sale financial assets
reclassified to profit or loss (149,301) (52,363)
Effective portion of changes in fair value of cash flow hedges - 5,543
Change in capital adjustments - decrease in gain of equity
method accounted investments (8,249) (50,526)
Change in capital adjustments - increase in loss of equity
method accounted investments (35,952) (41,224)
Foreign currency translation difference (44,455) (150,058)
Total items that may be reclassified subsequently to profit or loss (232,055) (109,223)
Other comprehensive loss for the year, net of income tax (147,086) (293,434)
Total comprehensive income for the year ₩3,669,973 3,571,270
Attributable to owners of the Parent Company 3,669,973 3,571,253
Attributable to non-controlling interests - 17
Note
Sales 4, 31 ₩47,597,897 47,242,933
Cost of sales 27, 31 (37,511,941) (36,536,005)
Gross profit 10,085,956 10,706,928
Selling expenses 23, 27 (4,411,711) (4,845,860)
General and administrative expenses 23, 27 (2,497,145) (2,338,817)
Operating profit 3,177,100 3,522,251
Share of profits of associates and joint ventures, gain on
disposal, and impairment loss 81,319,585 1,414,080
Finance income 24, 30 455,275 402,795
Finance costs 24, 30 (139,442) (211,145)
Other income 25 377,188 417,339
Other expenses 25 (361,130) (381,264)
Profit before income taxes 4,828,576 5,164,056
Income tax expense 26 (1,011,517) (1,299,352)
Profit for the year ₩3,817,059 3,864,704
Profit attributable to owners of the Parent Company 3,817,059 3,864,687
Profit attributable to non-controlling interests - 17
Earnings per share
Basic earnings per share in won 21 ₩9,425 9,546
Diluted earnings per share in won 21 ₩9,425 9,545
See accompanying notes to the consolidated financial statements.
For the years ended December 31, 2013 and 2012 (In millions of won, except earnings per share information) For the years ended December 31, 2013 and 2012 (In millions of won)
•