Kia 2013 Annual Report Download - page 44
Download and view the complete annual report
Please find page 44 of the 2013 Kia annual report below. You can navigate through the pages in the report by either clicking on the pages listed below, or by using the keyword search tool below to find specific information within the annual report.-
 1
1 -
2
-
3
-
4
-
5
-
6
-
7
-
8
-
9
-
10
-
11
-
12
-
13
-
14
-
15
-
16
-
17
-
18
-
19
-
20
-
21
-
22
-
23
-
24
-
25
-
26
-
27
-
28
-
29
-
30
-
31
-
32
-
33
-
 34
34 -
 35
35 -
 36
36 -
 37
37 -
 38
38 -
 39
39 -
 40
40 -
 41
41 -
 42
42 -
 43
43 -
 44
44 -
 45
45 -
 46
46 -
 47
47 -
 48
48 -
 49
49 -
 50
50 -
 51
51 -
 52
52 -
 53
53 -
 54
54 -
55
-
56
-
57
-
58
-
59
-
60
-
61
-
62
-
63
-
64
-
65
-
66
-
67
-
68
 |
 |

The Company recognizes a deferred tax liability for all taxable temporary differences associated with investments in subsidiaries,
associates and interests in joint ventures, except to the extent that the Company is able to control the timing of the reversal of
the temporary difference and it is probable that the temporary difference will not reverse in the foreseeable future. The Company
recognizes a deferred tax asset for all deductible temporary differences arising from investments in subsidiaries and associates, to the
extent that it is probable that the temporary difference will reverse in the foreseeable future and taxable profit will be available against
which the temporary difference can be utilized.
The carrying amount of a deferred tax asset is reviewed at the end of each reporting period and reduces the carrying amount to the
extent that it is no longer probable that sufficient taxable profit will be available to allow the benefit of part or all of that deferred tax
asset to be utilized.
Deferred tax assets and liabilities are measured at the tax rates that are expected to apply to the period when the asset is realized
or the liability is settled, based on tax laws that have been enacted or substantively enacted by the end of the reporting period. The
measurement of deferred tax liabilities and deferred tax assets reflects the tax consequences that would follow from the manner in
which the Company expects, at the end of the reporting period to recover or settle the carrying amount of its assets and liabilities.
Deferred tax assets and liabilities are offset only if there is a legally enforceable right to offset the related current tax liabilities and assets,
and they relate to income taxes levied by the same tax authority and they intend to settle current tax liabilities and assets on a net basis.
(x) Earnings per share
The Company presents basic and diluted earnings per share (EPS) data for its ordinary shares. Basic EPS is calculated by dividing
the profit or loss attributable to ordinary shareholders of the Company by the weighted average number of ordinary shares outstanding
during the period, adjusted for own shares held. Diluted EPS is determined by adjusting the profit or loss attributable to ordinary
shareholders and the weighted average number of ordinary shares outstanding, adjusted for own shares held, for the effects of all
potential dilutive ordinary shares.
(y) Operating segments
An operating segment is a component of the Company that: 1) engages in business activities from which it may earn revenues
and incur expenses, including revenues and expenses that relate to transactions with other components of the Company, 2) whose
operating results are reviewed regularly by the Company’s chief operating decision maker (‘CODM’) in order to allocate resources and
assess its performance, and 3) for which discrete financial information is available.
Management has determined that the CODM of the Company is the CEO. The CODM does not receive and therefore does not review
discrete financial information for any component of the Company. Consequently, no operating segment information is included in these
consolidated financial statements. Entity wide disclosures of geographic and product revenue information are provided in note 4 to the
consolidated financial statements.
(z) New standards and interpretations not yet adopted
The following new standards, interpretations and amendments to existing standards have been published and are mandatory for the
Company for annual periods beginning after January 1, 2013, and the Company has not early adopted them. Management believes
the impact of the amendments on the Company’s consolidated financial statements is not significant.
(i) K-IFRS No.1032, ‘Financial Instruments: Presentation’
The amendments clarified the application guidance related to ‘offsetting a financial asset and a financial liability’. The amendment is
mandatorily effective for periods beginning on or after January 1, 2014 with earlier application permitted.
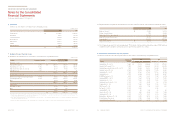
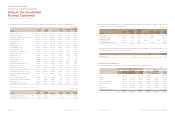
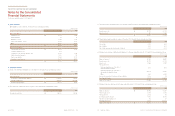
For the years ended December 31, 2013 and 2012
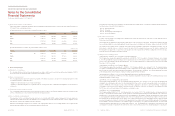
External sales ₩17,325,792 17,090,431 12,360,058 821,616 - 47,597,897
Property, plant and equipment,
intangible assets and other 9,079,840 1,174,659 1,229,526 5,269 53,704 11,542,998
(In millions of won)
(b) The following tables provide information of sales by geographic locations based on the location of customers and non-current assets
as of and for the year ended December 31, 2012:
External sales ₩17,734,873 16,799,524 11,797,175 911,361 - 47,242,933
Property, plant and equipment,
intangible assets and other 8,745,685 1,297,834 1,214,199 6,362 32,553 11,296,633
(In millions of won)
4. Geographic and Other Information
The Company is engaged in manufacturing and sales of vehicles and parts, leasing of vehicles and rendering vehicle maintenance
services. Leasing income and maintenance services are insignificant to total sales. Revenue information for each product and service
is not available and management believes the cost to develop such information would be excessive. Consequently revenue amounts
for each product and service is not disclosed.
(a) The following tables provide information of sales by geographic locations based on the location of customers and non-current assets
as of and for the year ended December 31, 2013:
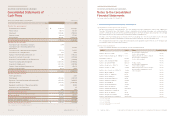
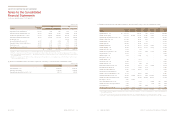
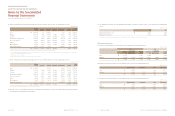
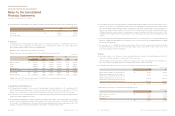
Cash on hand ₩477 321
Deposits with financial institutions 2,310,787 1,902,988
₩2,311,264 1,903,309
(In millions of won)
5. Cash, Cash Equivalents and Restricted Financial Instrument
(a) Cash and cash equivalents as of December 31, 2013 and 2012 are summarized as follows:
Win-Win cooperation deposits ₩27,000 27,000
Guarantee deposits 10 13
Green mold fund 20,000 20,000
Other deposits 31,954 3,384
₩78,964 50,397
(In millions of won)
(b) Financial instruments which are restricted in use for as of December 31, 2013 and 2012 are summarized as follows: