Kia 2013 Annual Report Download - page 45
Download and view the complete annual report
Please find page 45 of the 2013 Kia annual report below. You can navigate through the pages in the report by either clicking on the pages listed below, or by using the keyword search tool below to find specific information within the annual report.-
 1
1 -
2
-
3
-
4
-
5
-
6
-
7
-
8
-
9
-
10
-
11
-
12
-
13
-
14
-
15
-
16
-
17
-
18
-
19
-
20
-
21
-
22
-
23
-
24
-
25
-
26
-
27
-
28
-
29
-
30
-
31
-
32
-
33
-
34
-
 35
35 -
 36
36 -
 37
37 -
 38
38 -
 39
39 -
 40
40 -
 41
41 -
 42
42 -
 43
43 -
 44
44 -
 45
45 -
 46
46 -
 47
47 -
 48
48 -
 49
49 -
 50
50 -
 51
51 -
 52
52 -
 53
53 -
 54
54 -
 55
55 -
56
-
57
-
58
-
59
-
60
-
61
-
62
-
63
-
64
-
65
-
66
-
67
-
68
 |
 |
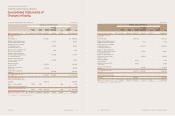
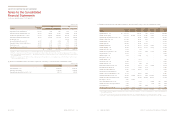
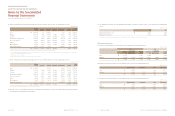
For the years ended December 31, 2013 and 2012
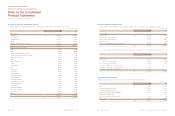
7. Available-for-sale Financial Assets
(a) Available-for-sale financial assets as of December 31, 2013 and 2012 are summarized as follows:
Marketable securities
Hyundai WIA Corporation 14.20% ₩237,510 694,260 632,143
Hyundai Hysco Co., Ltd. (*1) 15.65% 63,794 148,172 570,610
HMC Investment Securities Co., Ltd. (*2) 3.68% 25,939 10,584 15,319
SeAH Besteel Corp. 0.00% 20 45 50
327,263 853,061 1,218,122
Non-marketable securities(*3)
WIA Automotive Engine (Shang-dong) Company 18.00% 47,332 47,332 47,332
Hyundai Capital America 15.00% 316,590 316,590 321,330
Other 19,494 19,494 19,574
383,416 383,416 388,236
Debt securities
Subordinate securities 8,000 8,000 -
Other 630 630 -
8,630 8,630 -
₩719,309 1,245,107 1,606,358
(In millions of won)
(*1) Hyundai Steel Company merged with the Cold-Rolled Coil Division spun off from Hyundai Hysco Co., Ltd. which resulted in disposal of this available-for-sale financial assets in the
amount of ₩ 372,847 million for the year ended December 31, 2013.
(*2) The Company recognized impairment loss of investment in HMC Investment Securities Co., Ltd. amounting to ₩ 15,355 million since the fair value significantly goes below historical
cost for the year ended December 31, 2013.
(*3) Investments in equity instruments that do not have a quoted market price in an active market, and whose fair value cannot be reliably measured are measured at cost.
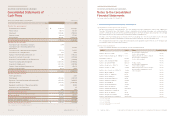
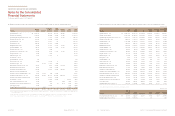
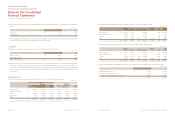
Balance at January 1 ₩730,334 562,732
Changes in unrealized gain 7,786 236,683
Realized in profit or loss upon disposal (196,967) (69,081)
Balance at December 31 before taxes 541,153 730,334
Income tax effect (130,959) (176,741)
Balance at December 31 ₩410,194 553,593
(In millions of won)
(b) Changes in fair value of available-for-sale financial assets for the years ended December 31, 2013 and 2012 are summarized as follows:
(c) The Company has provided 1,500 units (carrying amount: ₩ 593 million) of the Korea Defense Industry Association (“KDIA”), which are
included in long-term available-for-sale financial assets for a performance guarantee on a contract.
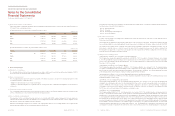
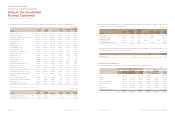
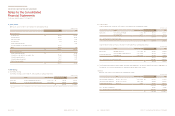
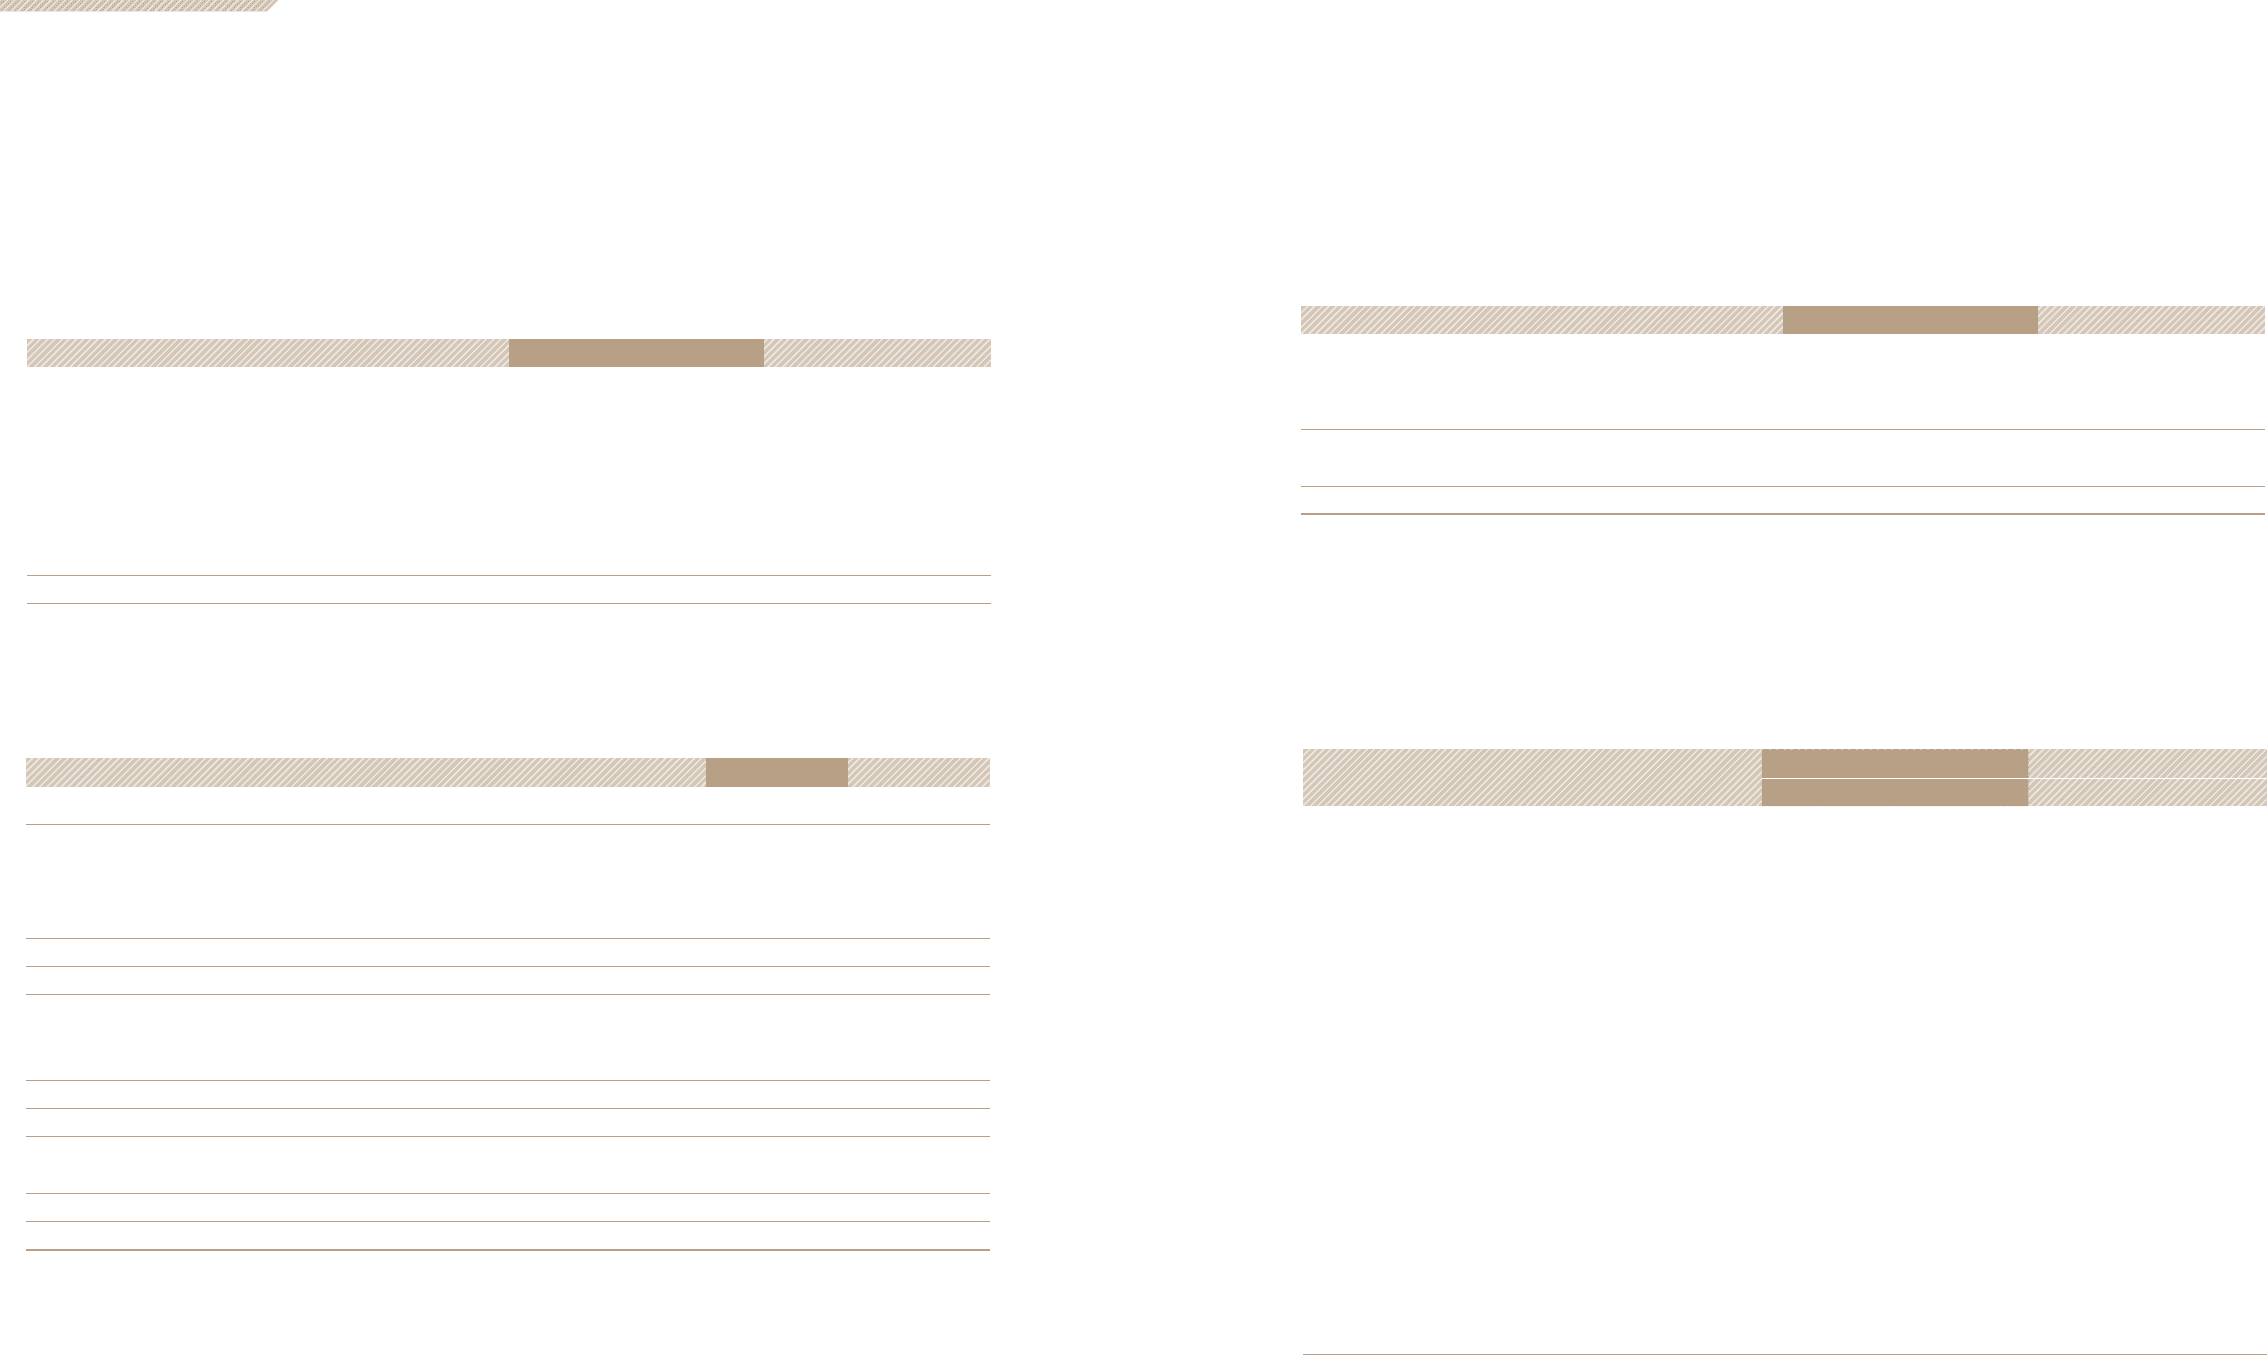
Hyundai Mobis Co., Ltd.(*1) 16.88% ₩215,012 3,288,988 215,012 2,775,505
Hyundai Steel Company (*1, 4) 19.78% 618,000 2,566,364 245,153 2,092,416
Hyundai Engineering & Construction Co., Ltd.(*1) 5.23% 746,234 762,700 746,234 755,953
Hyundai Powertech Co., Ltd. 37.58% 172,576 344,798 172,576 310,230
Hyundai Card Co., Ltd.(*1) 11.48% 147,960 271,642 147,960 251,943
Hyundai Dymos Inc. 45.37% 89,438 261,013 89,438 225,631
EUKOR Car Carriers Inc.(*1) 8.00% 19,565 99,070 19,565 85,178
Hyundai AMCO Co., Ltd.(*1) 19.99% 10,067 129,764 10,067 112,375
Hyundai Partecs Co., Ltd. 31.00% 12,400 20,576 12,400 19,952
Hyundai Autoever Systems Co., Ltd. 20.00% 1,000 44,487 1,000 37,134
Donghee Auto Co., Ltd. 35.10% 10,530 14,556 10,530 12,950
TRW Steering Co., Ltd. 29.00% 8,952 1,124 8,952 2,215
Kia Tigers Co., Ltd.(*2) 100.00% 20,300 - 20,300 -
Hyundai NGV Co., Ltd. 24.39% 250 1,653 250 250
Haevichi Resort Co., Ltd. 40.00% 8,520 22,962 8,520 19,852
Hyundai Autron Co., Ltd. 20.00% 20,116 19,212 20,116 18,690
Beijing Dymos Transmission Co., Ltd. 24.08% 22,790 58,113 22,790 58,334
China Millennium Corporations 30.30% 27,185 21,852 27,185 19,505
Hyundai Motor Group China Ltd. 30.00% 19,671 93,526 9,211 60,391
(In millions of won)
8. Investments in Associates and Joint Ventures
(a) Details of investments in associates and joint ventures as of December 31, 2013 and 2012 are summarized as follows:
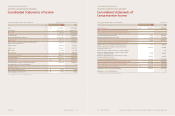
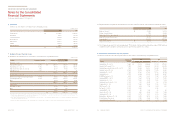
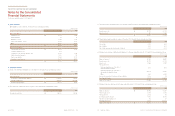
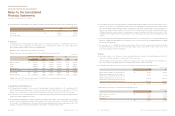
6. Inventories
Inventories as of December 31, 2013 and 2012 are summarized as follows:
Finished goods ₩3,099,839 2,744,556
Merchandise 42,715 190,924
Semi-finished goods 445,778 468,067
Work-in-process 196,921 161,086
Raw materials 332,201 441,756
Supplies 145,397 105,165
Materials-in-transit 68,516 111,396
₩4,331,367 4,222,950
(In millions of won)