Honda 2013 Annual Report Download - page 7
Download and view the complete annual report
Please find page 7 of the 2013 Honda annual report below. You can navigate through the pages in the report by either clicking on the pages listed below, or by using the keyword search tool below to find specific information within the annual report.-
 1
1 -
 2
2 -
 3
3 -
 4
4 -
 5
5 -
 6
6 -
 7
7 -
 8
8 -
 9
9 -
 10
10 -
 11
11 -
 12
12 -
 13
13 -
 14
14 -
 15
15 -
 16
16 -
 17
17 -
 18
18 -
19
-
20
-
21
-
22
-
23
-
24
-
25
-
26
-
27
-
28
-
29
-
30
-
31
-
32
-
33
-
34
-
35
-
36
-
37
-
38
-
39
-
40
-
41
-
42
-
43
-
44
-
45
-
46
-
47
-
48
-
49
-
50
-
51
-
52
-
53
-
54
-
55
-
56
-
57
-
58
-
59
-
60
-
61
-
62
-
63
-
64
-
65
-
66
-
67
-
68
 |
 |

Yen
(millions except per share data)
2011 2012 2013
Per share data (Yen)
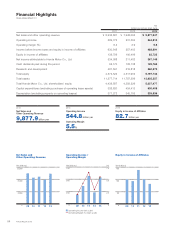
Net income attributable to Honda Motor Co., Ltd. ¥ 295.67 ¥ 117.34 ¥ 203.71
Dividends paid 51 60 72
Total Honda Motor Co., Ltd. shareholders’ equity 2,463.29 2,437.01 2,795.03
Shareholders’ equity ratio (%)* 38.3 37.3 36.9
Return on equity (%) 12.2 4.8 7.8
Cash flows from operating activities ¥1,096,613 ¥ 761,538 ¥ 800,744
Cash flows from investing activities (731,390) (673,069) (1,069,756)
Cash flows from financing activities (126,192) (68,230) 119,567
Cash and cash equivalents at end of year 1,279,024 1,247,113 1,206,128
* Shareholders’ equity ratio: Honda Motor Co., Ltd. Shareholders’ equity / Total assets.
3,500
7,000
14,000
10,500
009 10 11 12 13
1,500
750
2,250
3,000
0
Total Assets / Total Honda Motor
Co., Ltd. Shareholders’ Equity /
Total Honda Motor Co., Ltd.
Shareholders’ Equity per Common Share
Yen (billions)
2013
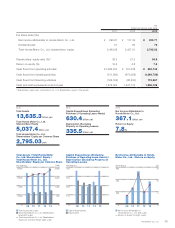
Total Assets
13,635.3 billion yen
Total Honda Motor Co., Ltd.
Shareholders’ Equity
5,037.4 billion yen
Total Honda Motor Co., Ltd.
Shareholders’ Equity per Common Share
2,795.03 yen
Net Income Attributable to
Honda Motor Co., Ltd. (left scale)
Return on Equity (%) (right scale)
Capital Expenditures
Depreciation
Total Assets (left scale)
Total Honda Motor Co., Ltd. Shareholders’
Equity (left scale)
Total Honda Motor Co., Ltd. Shareholders’
Equity per Common Share (right scale)
0 0
09 10 11 12 13
200
400
600
5
10
15
2013
Net Income Attributable to
Honda Motor Co., Ltd.
367.1 billion yen
Return on Equity
7.8%
Net Income Attributable to Honda
Motor Co., Ltd. / Return on Equity
Yen (billions) (%)
350
175
700
525
009 10 11 12 13
2013
Capital Expenditures (Excluding
Purchase of Operating Lease Assets)
630.4 billion yen
Depreciation (Excluding
Property on Operating Leases)
335.5 billion yen
Capital Expenditures (Excluding
Purchase of Operating Lease Assets) /
Depreciation (Excluding Property on
Operating Leases)
Yen (billions)
(Yen)
Honda Motor Co., Ltd. 05