Honda 2013 Annual Report Download - page 61
Download and view the complete annual report
Please find page 61 of the 2013 Honda annual report below. You can navigate through the pages in the report by either clicking on the pages listed below, or by using the keyword search tool below to find specific information within the annual report.-
 1
1 -
2
-
3
-
4
-
5
-
6
-
7
-
8
-
9
-
10
-
11
-
12
-
13
-
14
-
15
-
16
-
17
-
18
-
19
-
20
-
21
-
22
-
23
-
24
-
25
-
26
-
27
-
28
-
29
-
30
-
31
-
32
-
33
-
34
-
35
-
36
-
37
-
38
-
39
-
40
-
41
-
42
-
43
-
44
-
45
-
46
-
47
-
48
-
49
-
50
-
 51
51 -
 52
52 -
 53
53 -
 54
54 -
 55
55 -
 56
56 -
 57
57 -
 58
58 -
 59
59 -
 60
60 -
 61
61 -
 62
62 -
 63
63 -
 64
64 -
 65
65 -
 66
66 -
 67
67 -
 68
68
 |
 |

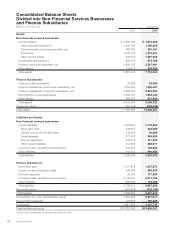
Consolidated Statements of Cash Flows
Divided into Non-Financial Services Businesses
and Finance Subsidiaries
Years ended March 31, 2012 and 2013 Yen (millions)
2012 2013
Non-financial
services
businesses
Finance
subsidiaries
Reconciling
Items Consolidated
Non-financial
services
businesses
Finance
subsidiaries
Reconciling
Items Consolidated
Cash flows from operating activities:
Net Income ¥ 109,016 ¥ 113,058 ¥ — ¥ 222,074 ¥ 295,590 ¥ 97,048 ¥ — ¥ 392,638
Adjustments to reconcile net income to
net cash provided by operating activities:
Depreciation 343,542 211,325 —554,867 334,303 256,166 —590,469
Deferred income taxes (20,191) 69,852 —49,661 32,022 21,230 —53,252
Equity in income of affiliates (100,406) — — (100,406) (82,723) — — (82,723)
Dividends from affiliates 95,106 — — 95,106 84,705 — — 84,705
Damaged and impairment loss on
long-lived assets 10,590 1,514 —12,104 —4,773 —4,773
Loss (gain) on derivative instruments, net
12,140 (13,987) —(1,847) 28,426 6,601 —35,027
Decrease (increase) in trade accounts
and notes receivable (34,607) (2,516) 1,648 (35,475) (3,881) (87,972) 1,358 (90,495)
Decrease (increase) in inventories (154,222) — — (154,222) (74,662) — — (74,662)
Increase (decrease) in trade accounts
and notes payable 240,003 —2,811 242,814 (92,277) —(2,915) (95,192)
Other, net (83,705) (14,627) (24,806) (123,138) 16,791 (43,499) 9,660 (17,048)
Net cash provided by (used in)
operating activities
417,266 364,619 (20,347) 761,538 538,294 254,347 8,103 800,744
Cash flows from investing activities:
Decrease (increase) in investments
and advances* 32,166 (9,305) (10,133) 12,728 14,836 (670) (21,218) (7,052)
Proceeds from sales of investments
in affiliates 9,957 — — 9,957 — — — —
Capital expenditures (394,490) (2,728) —(397,218) (625,128) (1,751) —(626,879)
Proceeds from sales of property,
plant and equipment 23,091 169 —23,260 44,039 143 —44,182
Proceeds from insurance recoveries for
damage property, plant and equipment 16,217 — — 16,217 9,600 — — 9,600
Collections (acquisitions) of finance
subsidiaries-receivables —(16,014) (3,502) (19,516) —(118,006) (127) (118,133)
Purchase of operating lease assets
—(683,767) —(683,767) —(793,118) —(793,118)
Proceeds from sales of operating
lease assets —365,270 —365,270 —418,086 —418,086
Other, net — — — — 3,558 — — 3,558
Net cash provided by (used in)
investing activities (313,059) (346,375) (13,635) (673,069) (553,095) (495,316) (21,345) (1,069,756)
Cash flows from financing activities:
Proceeds from (repayment of)
short-term debt, net*
38,622 (162,515) 19,297 (104,596) 65,845 72,307 15,587 153,739
Proceeds from long-term debt* 100,865 1,058,570 (7,464) 1,151,971 82,281 1,025,408 (6,220) 1,101,469
Repayment of long-term debt* (72,207) (917,530) 22,149 (967,588) (117,784) (856,793) 3,875 (970,702)
Dividends paid (108,138) — — (108,138) (129,765) — — (129,765)
Dividends paid to noncontrolling
interests (15,763) — — (15,763) (6,250) — — (6,250)
Sales (purchases) of treasury stock, net (7) — — (7) (7) — — (7)
Other, net (24,109) — — (24,109) (28,917) — — (28,917)
Net cash provided by (used in)
financing activities (80,737) (21,475) 33,982 (68,230) (134,597) 240,922 13,242 119,567
Effect of exchange rate changes on
cash and cash equivalents (51,647) (503) —(52,150) 105,242 3,218 —108,460
Net change in cash and cash equivalents
(28,177) (3,734) —(31,911) (44,156) 3,171 —(40,985)
Cash and cash equivalents at
beginning of period 1,252,362 26,662 —1,279,024 1,224,185 22,928 —1,247,113
Cash and cash equivalents at
end of period ¥1,224,185 ¥ 22,928 ¥ — ¥1,247,113 ¥1,180,029 ¥ 26,099 ¥ — ¥ 1,206,128
Notes: 1. Non-financial services businesses lend to finance subsidiaries. These cash flows are included in the decrease (increase) in investments and advances, increase
(decrease) in short-term debt, proceeds from long-term debt, and repayment of long-term debt (marked by *). The amount of the loans to finance subsidiaries is a
JPY 10,133 million decrease for the fiscal year ended March 31, 2012, and a JPY 21,218 million decrease for the fiscal year ended March 31, 2013, respectively.
2. Decrease (increase) in trade accounts and notes receivable for finance subsidiaries is due to the reclassification of finance subsidiaries-receivables which relate to
sales of inventory in the unaudited consolidated statements of cash flows presented above.
3. Regarding non-financial services businesses, the amounts of depreciation in cash flows from operating activities, and other, net in cash flows from financing
activities for the fiscal year ended March 31, 2012 have been corrected from the amounts previously disclosed.
Honda Motor Co., Ltd. 59