Honda 2013 Annual Report Download - page 20
Download and view the complete annual report
Please find page 20 of the 2013 Honda annual report below. You can navigate through the pages in the report by either clicking on the pages listed below, or by using the keyword search tool below to find specific information within the annual report.-
 1
1 -
2
-
3
-
4
-
5
-
6
-
7
-
8
-
9
-
 10
10 -
 11
11 -
 12
12 -
 13
13 -
 14
14 -
 15
15 -
 16
16 -
 17
17 -
 18
18 -
 19
19 -
 20
20 -
 21
21 -
 22
22 -
 23
23 -
 24
24 -
 25
25 -
 26
26 -
 27
27 -
 28
28 -
 29
29 -
 30
30 -
31
-
32
-
33
-
34
-
35
-
36
-
37
-
38
-
39
-
40
-
41
-
42
-
43
-
44
-
45
-
46
-
47
-
48
-
49
-
50
-
51
-
52
-
53
-
54
-
55
-
56
-
57
-
58
-
59
-
60
-
61
-
62
-
63
-
64
-
65
-
66
-
67
-
68
 |
 |

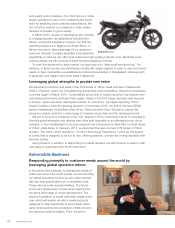
Review of Operations
Automobile Business
Honda’s consolidated unit sales of automobiles in fiscal year 2013 totaled 3,408 thousand units,
an increase of 37.3% from the previous fiscal year, due mainly to an increase in unit sales in all
regions. Growth in unit sales was supported mainly by recoveries from the Great East Japan
Earthquake and the floods in Thailand, as well as a boost from the rollout of new models.
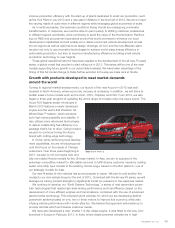
JAPAN
Total industry automobile sales in Japan*1 for fiscal year 2013 rose approximately 10% from the
previous fiscal year, to approximately 5,210 thousand units. Automobile sales held firm thanks to the
pump-priming effect of government stimulus policies that provided tax breaks and subsidies for
purchasing eco-cars in the first half of the fiscal year. Another contributing factor was the recovery
from the Great East Japan Earthquake.
Honda’s consolidated unit sales in Japan rose 18.1% from the previous fiscal year to 685
thousand units*2. This result was mainly due to strong sales of the N Box mini vehicle and Step
WGN, along with the positive impact of the launch of the new mini vehicle N Box + and N-ONE.
In production activities, Honda’s unit production of automobiles in Japan for fiscal year 2013
increased 0.6% from the previous fiscal year to 876 thousand units, mainly due to higher sales in
Japan, despite the shift of some production overseas.
*1 Source: JAMA (Japan Automobile Manufacturers Association): (as measured by the number of regular vehicle registrations (661 cc or
higher) and mini vehicles (660 cc or lower))
*2 Certain sales of automobiles that are financed with residual value-type auto loans by our Japanese finance subsidiaries are accounted for
as operating leases in conformity with U.S. generally accepted accounting principles and are not included in consolidated net sales to the
external customers in our automobile business. As a result, they are not included in consolidated unit sales.
Yen (millions) 2012 2013 % change
Japan ¥1,329,645 ¥1,462,664 10.0%
North America 2,855,683 3,905,276 36.8
Europe 355,963 388,464 9.1
Asia 836,301 1,385,449 65.7
Other Regions 428,383 567,363 32.4
Total ¥5,805,975 ¥7,709,216 32.8%
Net Sales by Region
0
7,500
2,500
5,000
10,000
0.0
6.0
2.0
4.0
8.0
–2.0
09 10 11 12 13
Yen (billions) (%)
Japan North America Europe
Asia Other Regions
Operating Margin
N-ONE
(Japan)
N Box
+
(Japan)
Annual Report 201318