Honda 2013 Annual Report Download - page 57
Download and view the complete annual report
Please find page 57 of the 2013 Honda annual report below. You can navigate through the pages in the report by either clicking on the pages listed below, or by using the keyword search tool below to find specific information within the annual report.-
 1
1 -
2
-
3
-
4
-
5
-
6
-
7
-
8
-
9
-
10
-
11
-
12
-
13
-
14
-
15
-
16
-
17
-
18
-
19
-
20
-
21
-
22
-
23
-
24
-
25
-
26
-
27
-
28
-
29
-
30
-
31
-
32
-
33
-
34
-
35
-
36
-
37
-
38
-
39
-
40
-
41
-
42
-
43
-
44
-
45
-
46
-
 47
47 -
 48
48 -
 49
49 -
 50
50 -
 51
51 -
 52
52 -
 53
53 -
 54
54 -
 55
55 -
 56
56 -
 57
57 -
 58
58 -
 59
59 -
 60
60 -
 61
61 -
 62
62 -
 63
63 -
 64
64 -
 65
65 -
 66
66 -
 67
67 -
68
 |
 |

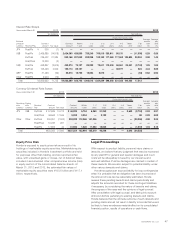
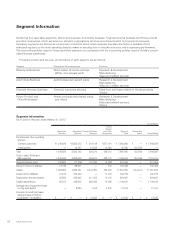
As of and for the year ended March 31, 2013
Yen (millions)
Motorcycle
Business
Automobile
Business
Financial Services
Business
Power
Product
and Other
Businesses
Segment
Total
Reconciling
Items Consolidated
Net sales and other operating
revenue:
External customers ¥1,339,549 ¥7,709,216 ¥ 548,506 ¥280,676 ¥ 9,877,947 ¥ — ¥ 9,877,947
Intersegment —14,374 11,750 10,994 37,118 (37,118) —
Total 1,339,549 7,723,590 560,256 291,670 9,915,065 (37,118) 9,877,947
Cost of sales, SG&A and
R&D expenses 1,229,316 7,437,599 402,098 301,242 9,370,255 (37,118) 9,333,137
Segment income (loss) 110,233 285,991 158,158 (9,572) 544,810 —544,810
Equity in income of affiliates 25,606 56,361 —756 82,723 —82,723
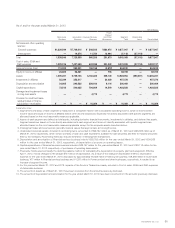
Assets 1,095,357 5,759,126 6,765,322 309,149 13,928,954 (293,597) 13,635,357
Investments in affiliates 85,039 352,317 —20,020 457,376 —457,376
Depreciation and amortization 34,665 290,522 256,166 9,116 590,469 —590,469
Capital expenditures 73,513 540,625 794,869 14,519 1,423,526 —1,423,526
Damaged and impairment losses
on long-lived assets — — 4,773 —4,773 —4,773
Provision for credit and lease
residual losses on finance
subsidiaries—receivables ¥ — ¥ — ¥ 10,059 ¥ — ¥ 10,059 ¥ — ¥ 10,059
Explanatory notes:
1. Segment income (loss) of each segment is measured in a consistent manner with consolidated operating income, which is income before
income taxes and equity in income of affiliates before other income (expenses). Expenses not directly associated with specific segments are
allocated based on the most reasonable measures applicable.
2. Assets of each segment are defined as total assets, including derivative financial instruments, investments in affiliates, and deferred tax assets.
Segment assets are based on those directly associated with each segment and those not directly associated with specific segments are
allocated based on the most reasonable measures applicable except for the corporate assets described below.
3. Intersegment sales and revenues are generally made at values that approximate arm’s-length prices.
4. Unallocated corporate assets, included in reconciling items, amounted to ¥399,732 million as of March 31, 2012 and ¥293,583 million as of
March 31, 2013, respectively, which consist primarily of cash and cash equivalents, available-for-sale securities and held-to-maturity securities
held by the Company. Reconciling items also include elimination of intersegment transactions.
5. Depreciation and amortization of Financial services business include ¥209,762 million for the year ended March 31, 2012 and ¥254,933
million for the year ended March 31, 2013, respectively, of depreciation of property on operating leases.
6. Capital expenditures of Financial services business includes ¥683,767 million for the year ended March 31, 2012 and ¥793,118 million for the
year ended March 31, 2013, respectively, of purchases of operating lease assets.
7. Previously, Honda used principally the declining-balance method for calculating the depreciation of property, plant and equipment. Effective
April 1, 2012, Honda changed to the straight line method of depreciation. As a result of the change in depreciation method, depreciation
expense for the year ended March 31, 2013 decreased by approximately ¥6,358 million in Motorcycle business, ¥48,568 million in Automobile
business, ¥77 million in Financial services business and ¥1,297 million in Power product and other businesses, respectively. It resulted in an
increase of segment income.
8. For the year ended March 31, 2012 and 2013, impacts of the floods in Thailand are mainly included in Cost of sales, SG&A and R&D expenses
of Automobile business.
9. The amounts of Assets as of March 31, 2012 have been corrected from the amounts previously disclosed.
10. The amounts of Depreciation and amortization for the year ended March 31, 2012 have been corrected from the amounts previously disclosed.
Honda Motor Co., Ltd. 55