Honda 2013 Annual Report Download - page 44
Download and view the complete annual report
Please find page 44 of the 2013 Honda annual report below. You can navigate through the pages in the report by either clicking on the pages listed below, or by using the keyword search tool below to find specific information within the annual report.-
 1
1 -
2
-
3
-
4
-
5
-
6
-
7
-
8
-
9
-
10
-
11
-
12
-
13
-
14
-
15
-
16
-
17
-
18
-
19
-
20
-
21
-
22
-
23
-
24
-
25
-
26
-
27
-
28
-
29
-
30
-
31
-
32
-
33
-
 34
34 -
 35
35 -
 36
36 -
 37
37 -
 38
38 -
 39
39 -
 40
40 -
 41
41 -
 42
42 -
 43
43 -
 44
44 -
 45
45 -
 46
46 -
 47
47 -
 48
48 -
 49
49 -
 50
50 -
 51
51 -
 52
52 -
 53
53 -
 54
54 -
55
-
56
-
57
-
58
-
59
-
60
-
61
-
62
-
63
-
64
-
65
-
66
-
67
-
68
 |
 |

Yen (billions)
For the year ended March 31, 2013 Retail
Direct
financing lease Wholesale Total
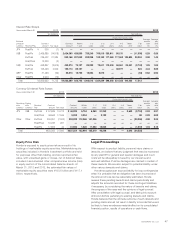
Allowance for credit losses
Balance at beginning of year ¥ 20.4 ¥ 1.1 ¥ 1.4 ¥ 23.0
Provision 8.7 0.3 0.0 9.1
Charge-offs (20.8) (0.9) (0.2) (22.0)
Recoveries 8.1 0.1 0.0 8.2
Adjustments from foreign currency translation 1.1 0.0 0.0 1.3
Balance at end of year ¥ 17.6 ¥ 0.7 ¥ 1.2 ¥ 19.7
Ending receivable balance ¥3,865.4 ¥448.6 ¥431.9 ¥4,746.0
Average receivable balance, net ¥3,429.8 ¥394.5 ¥334.1 ¥4,158.4
Net charge-offs as a % of average receivable balance 0.37% 0.21% 0.08% 0.33%
Allowance as a % of ending receivable balance 0.46% 0.18% 0.30% 0.42%
The following table provides information related to losses on operating leases due to customer defaults:
Yen (billions)
Fiscal years ended March 31 2012 2013
Provision for credit losses on past due rental payments ¥1.1 ¥1.1
Impairment losses on operating leases due to early termination ¥1.5 ¥4.7
Fiscal Year 2013 Compared with Fiscal Year 2012
The provision for credit losses on finance receivables
decreased by ¥1.6 billion, or 15%, and net charge-offs
decreased by ¥1.3 billion, or 9%. The decline in net charge-
offs is due mainly to the improved credit quality of our North
American portfolio. Impairment losses on operating leases
due to early termination increased by ¥3.2 billion, or 213%.
The increase was primarily attributable to the increase in the
volume of operating lease assets in North America.
Losses on Lease Residual Values
Our finance subsidiaries in North America establish contract
residual values of lease vehicles at lease inception based on
expectations of future used vehicle values, taking into consid-
eration external industry data. End-customers of leased vehi-
cles typically have an option to buy the leased vehicle for the
contractual residual value of the vehicle or to return the vehi-
cle to our finance subsidiaries through the dealer at the end
of the lease term. Likewise, dealers have the option to buy
the vehicle returned by the customer or to return the vehicle
to our finance subsidiaries. The likelihood that the leased
vehicle will be purchased varies depending on the difference
between the contractual residual value and the actual market
value of the vehicle at the end of the lease term. We are
exposed to risk of loss on the disposition of returned lease
vehicles when the proceeds from the sale of the vehicles are
less than the contractual residual values at the end of the
lease term. For direct financing leases, our finance subsidiar-
ies in North America purchase insurance to cover a portion of
the estimated residual value.
We periodically review the estimate of residual values.
For vehicle leases accounted for as operating leases, the
adjustments to estimated residual values result in changes
to the remaining depreciation expense to be recognized
prospectively on a straight-line basis over the remaining
term of the lease.
For vehicle leases accounted for as direct financing leases,
downward adjustments are made for declines in estimated
residual values that are deemed to be other-than-temporary.
The adjustments on the uninsured portion of the vehicle’s
residual value are recognized as a loss in the period in which
the estimate changed.
The primary components in estimating losses on lease
residual values are the expected frequency of returns, or the
percentage of leased vehicles we expect to be returned by
customers at the end of the lease term, and the expected
loss severity, or the expected difference between the residual
value and the amount we receive through sales of returned
vehicles plus proceeds from insurance, if any. We estimate
losses on lease residual values by evaluating several different
factors, including trends in historical and projected used
vehicle values and general economic measures.
We also test our operating leases for impairment whenever
events or changes in circumstances indicate that their carry-
ing values may not be recoverable.
Recoverability of operating leases to be held is mea-
sured by a comparison of the carrying amount of operating
leases to future net cash flows (undiscounted and without
interest charges) expected to be generated by the operat-
ing leases. If such operating leases are considered to be
Annual Report 201342