Honda 2013 Annual Report Download - page 48
Download and view the complete annual report
Please find page 48 of the 2013 Honda annual report below. You can navigate through the pages in the report by either clicking on the pages listed below, or by using the keyword search tool below to find specific information within the annual report.-
 1
1 -
2
-
3
-
4
-
5
-
6
-
7
-
8
-
9
-
10
-
11
-
12
-
13
-
14
-
15
-
16
-
17
-
18
-
19
-
20
-
21
-
22
-
23
-
24
-
25
-
26
-
27
-
28
-
29
-
30
-
31
-
32
-
33
-
34
-
35
-
36
-
37
-
 38
38 -
 39
39 -
 40
40 -
 41
41 -
 42
42 -
 43
43 -
 44
44 -
 45
45 -
 46
46 -
 47
47 -
 48
48 -
 49
49 -
 50
50 -
 51
51 -
 52
52 -
 53
53 -
 54
54 -
 55
55 -
 56
56 -
 57
57 -
 58
58 -
59
-
60
-
61
-
62
-
63
-
64
-
65
-
66
-
67
-
68
 |
 |

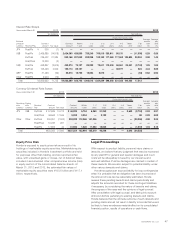
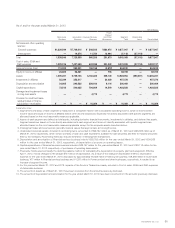
Interest Rate Risk
Finance Subsidiaries-Receivables
Years ended March 31 2012 2013
Yen (millions) Yen (millions)
Average
interest
rate
(%)
Expected maturity date
Total Fair value Total
Within
1 year
1–2
years
2–3
years
3–4
years
4–5
years
There-
after
Fair
value
Direct financing leases
JP¥ ¥ 73,920 *1¥ 106,735 26,777 18,899 16,657 15,116 13,794 15,492 *13.90
Other 306,419 *1341,937 93,446 91,386 86,075 62,807 8,214 9*12.22
Total—Direct financing
leases ¥ 380,339 *1¥ 448,672 120,223 110,285 102,732 77,923 22,008 15,501 *1
Other finance
subsidiaries-receivables
JP¥ ¥ 525,494 521,726 ¥ 542,165 166,889 123,447 101,285 79,878 51,356 19,310 544,441 3.90
US$ 2,541,603 2,574,794 3,025,075 1,119,666 718,304 571,747 382,177 178,190 54,991 3,059,686 3.53
Other 562,365 557,330 730,185 323,080 175,169 117,710 68,189 30,528 15,509 722,206 6.98
Total—Other finance
subsidiaries-receivables ¥3,629,462 3,653,850 ¥4,297,425 1,609,635 1,016,920 790,742 530,244 260,074 89,810 4,326,333
Total*2¥4,009,801 ¥4,746,097
*1 Under U.S. generally accepted accounting principles, disclosure of fair values of direct financing leases is not required.
*2 The finance subsidiaries-receivables include finance subsidiaries-receivables contained in trade accounts and notes receivable and other assets in the consolidated
balance sheets.
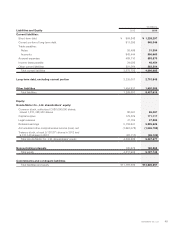
Long-Term Debt (including current portion)
Years ended March 31 2012 2013
Yen (millions) Yen (millions)
Average
interest
rate
(%)
Expected maturity date
Total Fair value Total
Within
1 year
1–2
years
2–3
years
3–4
years
4–5
years
There-
after Fair value
Japanese yen bonds ¥ 330,000 331,770 ¥ 340,000 40,000 30,000 60,000 80,000 95,000 35,000 342,627 0.61
Japanese yen medium-term
notes (Fixed rate) 67,740 68,266 42,923 6,489 5,989 27,450 — — 2,995 43,445 0.93
Japanese yen medium-term
notes (Floating rate) 63,574 63,655 5,490 3,494 —1,996 — — — 5,488 0.38
U.S. dollar medium-term
notes (Fixed rate) 692,185 732,402 942,086 160,135 201,341 187,293 117,059 117,059 159,199 994,988 3.02
U.S. dollar medium-term
notes (Floating rate) 155,535 156,450 235,427 15,077 159,198 48,509 3,278 9,365 —237,547 0.72
Asset backed notes 511,384 515,790 681,020 344,667 225,063 111,290 ———684,741 0.89
Loans and others—
primarily fixed rate 1,325,978 1,343,180 1,408,945 375,184 346,113 242,635 336,054 107,910 1,049 1,419,185 2.49
Total ¥3,146,396 3,211,513 ¥3,655,891 945,046 967,704 679,173 536,391 329,334 198,243 3,728,021
Annual Report 201346