Honda 2013 Annual Report Download - page 14
Download and view the complete annual report
Please find page 14 of the 2013 Honda annual report below. You can navigate through the pages in the report by either clicking on the pages listed below, or by using the keyword search tool below to find specific information within the annual report.-
 1
1 -
2
-
3
-
 4
4 -
 5
5 -
 6
6 -
 7
7 -
 8
8 -
 9
9 -
 10
10 -
 11
11 -
 12
12 -
 13
13 -
 14
14 -
 15
15 -
 16
16 -
 17
17 -
 18
18 -
 19
19 -
 20
20 -
 21
21 -
 22
22 -
 23
23 -
 24
24 -
25
-
26
-
27
-
28
-
29
-
30
-
31
-
32
-
33
-
34
-
35
-
36
-
37
-
38
-
39
-
40
-
41
-
42
-
43
-
44
-
45
-
46
-
47
-
48
-
49
-
50
-
51
-
52
-
53
-
54
-
55
-
56
-
57
-
58
-
59
-
60
-
61
-
62
-
63
-
64
-
65
-
66
-
67
-
68
 |
 |

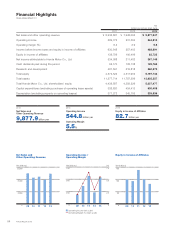
Net Sales / Operating Income
Yen (billions)
Honda Group Unit Sales 2012 2013
Consolidated Unit Sales 2012 2013
*1 The total unit sales of completed products of Honda, its consolidated subsidiaries and
its affiliates accounted for under the equity method
*2 The total unit sales of completed products of Honda and its consolidated subsidiaries
500
1,000
1,500
2,000
0
50
100
150
200
0
09 10 11 12 13
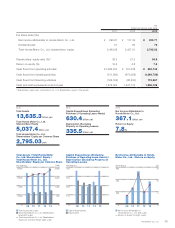
Net Sales / Operating Income (Loss)
Yen (billions)
0
2,500
5,000
10,000
7,500
0
200
400
800
600
–200
09 10 11 12 13
Net Sales (left scale) Operating Income (right scale)
Net Sales (left scale) Operating Income (Loss) (right scale)
Japan North
America
Europe Asia Other
Regions
217 250 179
1,813
13,035
217 250 179
1,813
7,051
Japan North
America
Europe Asia Other
Regions
Honda Group Unit Sales 2012 2013
Consolidated Unit Sales 2012 2013
*1 The total unit sales of completed products of Honda, its consolidated subsidiaries and
its affiliates accounted for under the equity method
*2 The total unit sales of completed products of Honda and its consolidated subsidiaries
692
1,731
171 298
1,122
Japan North
America
Europe Asia Other
Regions
685
1,731
171 298
523
Japan North
America
Europe Asia Other
Regions
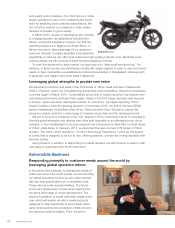
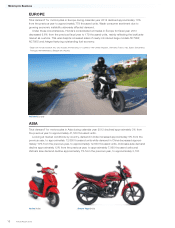
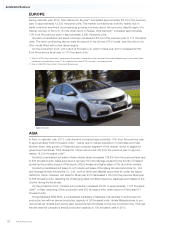
Motorcycle Business
NC700X
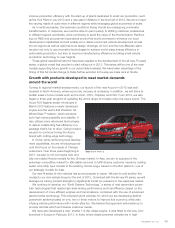
Accord
Percentage of Net Sales by Business
13.6%
Percentage of Net Sales by Business
78.0%
Automobile Business
Summary of Operating Results by Business
Years ended March 31
Honda Group Unit Sales *1 / Consolidated Unit Sales *2
(Thousands)
Honda Group Unit Sales *1 / Consolidated Unit Sales *2
(Thousands)
Note: Certain sales of automobiles that are financed with residual value type auto loans by our Japanese finance subsidiaries are accounted for as operating leases in conformity with U.S. generally
accepted accounting principles and are not included in consolidated net sales to the external customers in our automobile business. As a result, they are not included in Consolidated Unit Sales,
but are included in Honda Group Unit Sales of our automobile business.
Annual Report 201312