Honda 2013 Annual Report Download - page 59
Download and view the complete annual report
Please find page 59 of the 2013 Honda annual report below. You can navigate through the pages in the report by either clicking on the pages listed below, or by using the keyword search tool below to find specific information within the annual report.-
 1
1 -
2
-
3
-
4
-
5
-
6
-
7
-
8
-
9
-
10
-
11
-
12
-
13
-
14
-
15
-
16
-
17
-
18
-
19
-
20
-
21
-
22
-
23
-
24
-
25
-
26
-
27
-
28
-
29
-
30
-
31
-
32
-
33
-
34
-
35
-
36
-
37
-
38
-
39
-
40
-
41
-
42
-
43
-
44
-
45
-
46
-
47
-
48
-
 49
49 -
 50
50 -
 51
51 -
 52
52 -
 53
53 -
 54
54 -
 55
55 -
 56
56 -
 57
57 -
 58
58 -
 59
59 -
 60
60 -
 61
61 -
 62
62 -
 63
63 -
 64
64 -
 65
65 -
 66
66 -
 67
67 -
 68
68
 |
 |

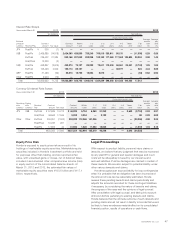
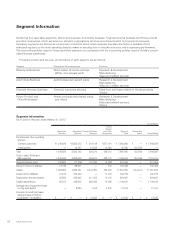
As of and for the year ended March 31, 2013
Yen (millions)
Japan
North
America Europe Asia
Other
Regions Total
Reconciling
Items Consolidated
Net sales and other operating
revenue:
External customers ¥1,925,333 ¥4,612,361 ¥536,856 ¥1,926,434 ¥876,963 ¥ 9,877,947 ¥ —¥ 9,877,947
Transfers between
geographic areas 1,968,179 244,741 105,254 379,213 19,504 2,716,891 (2,716,891) —
Total 3,893,512 4,857,102 642,110 2,305,647 896,467 12,594,838 (2,716,891) 9,877,947
Cost of sales, SG&A and
R&D expenses 3,715,084 4,648,184 641,650 2,158,889 860,773 12,024,580 (2,691,443) 9,333,137
Operating income (loss) 178,428 208,918 460 146,758 35,694 570,258 (25,448) 544,810
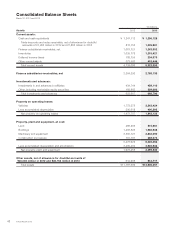
Assets 3,264,383 7,645,540 673,667 1,523,192 660,856 13,767,638 (132,281) 13,635,357
Long-lived assets ¥1,167,236 ¥2,481,097 ¥124,088 ¥ 434,827 ¥143,570 ¥ 4,350,818 ¥ —¥ 4,350,818
Explanatory notes:
1. Major countries or regions in each geographic area:
North America ......... United States, Canada, Mexico
Europe. . . . . . . . . . . . . . . United Kingdom, Germany, France, Italy, Belgium
Asia ................. Thailand, Indonesia, China, India, Vietnam
Other Regions ......... Brazil, Australia
2. Operating income (loss) of each geographical region is measured in a consistent manner with consolidated operating income, which is income
before income taxes and equity in income of affiliates before other income (expenses).
3. Assets of each geographical region are defined as total assets, including derivative financial instruments, investments in affiliates, and deferred
tax assets.
4. Sales and revenues between geographic areas are generally made at values that approximate arm’s-length prices.
5. Unallocated corporate assets, included in reconciling items, amounted to ¥399,732 million as of March 31, 2012 and ¥293,583 million as of
March 31, 2013, respectively, which consist primarily of cash and cash equivalents, available-for-sale securities and held-to-maturity securities
held by the Company. Reconciling items also include elimination of transactions between geographic areas.
6. Previously, Honda used principally the declining-balance method for calculating the depreciation of property, plant and equipment. Effective
April 1, 2012, Honda changed to the straight line method of depreciation. As a result of the change in depreciation method, depreciation
expense for the year ended March 31, 2013 decreased by approximately ¥42,486 million in Japan, ¥9,602 million in North America, ¥1,068
million in Europe and ¥3,144 million in Asia, respectively. It resulted in an increase of operating income.
7. For the year ended March 31, 2012 and 2013, impacts of the floods in Thailand are included in Cost of sales, SG&A and R&D expenses of Asia.
8. The amounts of Assets as of March 31, 2012 have been corrected from the amounts previously disclosed.
Honda Motor Co., Ltd. 57