Honda 2013 Annual Report Download - page 6
Download and view the complete annual report
Please find page 6 of the 2013 Honda annual report below. You can navigate through the pages in the report by either clicking on the pages listed below, or by using the keyword search tool below to find specific information within the annual report.-
 1
1 -
 2
2 -
 3
3 -
 4
4 -
 5
5 -
 6
6 -
 7
7 -
 8
8 -
 9
9 -
 10
10 -
 11
11 -
 12
12 -
 13
13 -
 14
14 -
 15
15 -
 16
16 -
 17
17 -
18
-
19
-
20
-
21
-
22
-
23
-
24
-
25
-
26
-
27
-
28
-
29
-
30
-
31
-
32
-
33
-
34
-
35
-
36
-
37
-
38
-
39
-
40
-
41
-
42
-
43
-
44
-
45
-
46
-
47
-
48
-
49
-
50
-
51
-
52
-
53
-
54
-
55
-
56
-
57
-
58
-
59
-
60
-
61
-
62
-
63
-
64
-
65
-
66
-
67
-
68
 |
 |
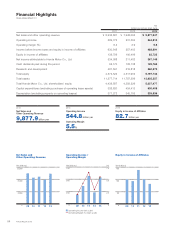
Financial Highlights
Years ended March 31
Yen
(millions except per share data)
2011 2012 2013
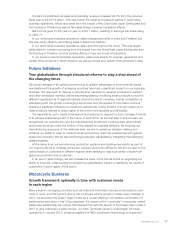
Net sales and other operating revenue ¥ 8,936,867 ¥ 7,948,095 ¥ 9,877,947
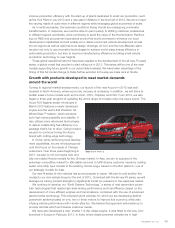
Operating income 569,775 231,364 544,810
Operating margin (%) 6.4 2.9 5.5
Income before income taxes and equity in income of affiliates 630,548 257,403 488,891
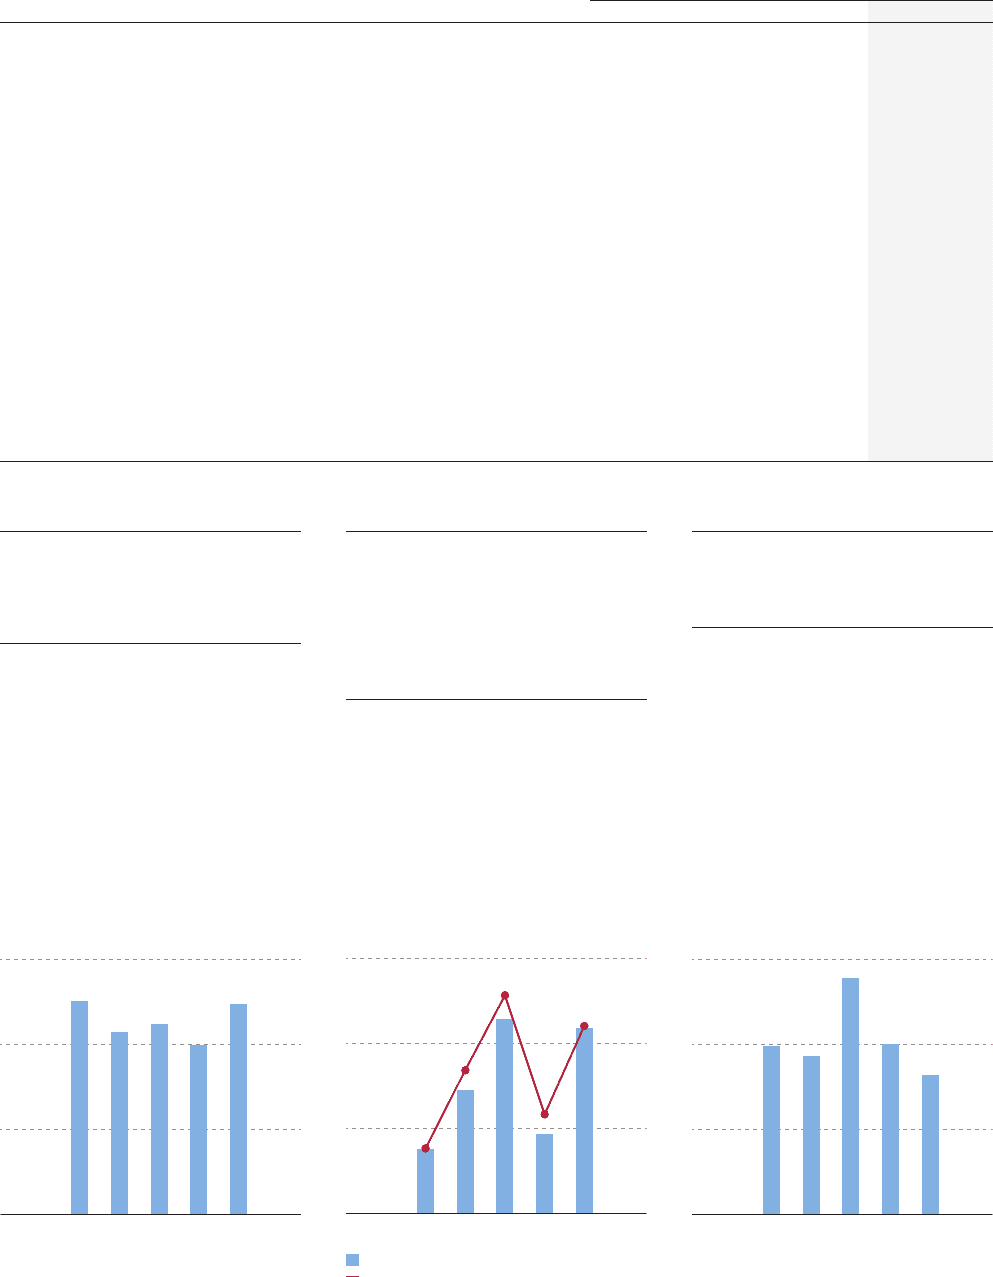
Equity in income of affiliates 139,756 100,406 82,723
Net income attributable to Honda Motor Co., Ltd. 534,088 211,482 367,149
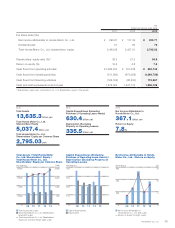
Cash dividends paid during the period 92,170 108,138 129,765
Research and development 487,591 519,818 560,270
Total equity 4,572,524 4,517,902 5,197,742
Total assets 11,577,714 11,787,599 13,635,357
Total Honda Motor Co., Ltd. shareholders’ equity 4,439,587 4,392,226 5,037,477
Capital expenditures (excluding purchase of operating lease assets) 326,620 424,413 630,408
Depreciation (excluding property on operating leases) 377,272 345,105 335,536
4,000
8,000
12,000
009 10 11 12 13
Net Sales and
Other Operating Revenue
Yen (billions)
2013
Net Sales and
Other Operating Revenue
9,877.9 billion yen
Operating Income (left scale)
Operating Margin (%) (right scale)
250
500
750
0
2.5
5.0
7.5
0
09 10 11 12 13
Operating Income /
Operating Margin
Yen (billions) (%)
2013
Operating Income
544.8 billion yen
Operating Margin
5.5%
50
100
150
009 10 11 12 13
2013
Equity in Income of Affiliates
82.7 billion yen
Equity in Income of Affiliates
Yen (billions)
Annual Report 201304