Honda 2013 Annual Report Download - page 58
Download and view the complete annual report
Please find page 58 of the 2013 Honda annual report below. You can navigate through the pages in the report by either clicking on the pages listed below, or by using the keyword search tool below to find specific information within the annual report.-
 1
1 -
2
-
3
-
4
-
5
-
6
-
7
-
8
-
9
-
10
-
11
-
12
-
13
-
14
-
15
-
16
-
17
-
18
-
19
-
20
-
21
-
22
-
23
-
24
-
25
-
26
-
27
-
28
-
29
-
30
-
31
-
32
-
33
-
34
-
35
-
36
-
37
-
38
-
39
-
40
-
41
-
42
-
43
-
44
-
45
-
46
-
47
-
 48
48 -
 49
49 -
 50
50 -
 51
51 -
 52
52 -
 53
53 -
 54
54 -
 55
55 -
 56
56 -
 57
57 -
 58
58 -
 59
59 -
 60
60 -
 61
61 -
 62
62 -
 63
63 -
 64
64 -
 65
65 -
 66
66 -
 67
67 -
 68
68
 |
 |

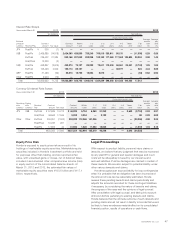
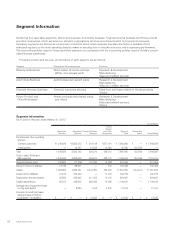
External Sales and Other Operating Revenue by Product or Service Groups
Yen (millions)
2012 2013
Motorcycles and relevant parts ¥1,286,319 ¥1,274,890
All-terrain vehicles (ATVs) and relevant parts 62,509 64,659
Automobiles and relevant parts 5,805,975 7,709,216
Financial, insurance services 516,148 548,506
Power products and relevant parts 208,661 221,321
Others 68,483 59,355
Total ¥7,948,095 ¥9,877,947
Geographical Information
As of and for the year ended March 31, 2012
Yen (millions)
Japan United States
Other
Countries Total
Net sales and other operating revenue ¥1,774,573 ¥3,099,810 ¥3,073,712 ¥7,948,095
Long-lived assets 1,048,402 1,889,567 596,939 3,534,908
As of and for the year ended March 31, 2013
Yen (millions)
Japan United States
Other
Countries Total
Net sales and other operating revenue ¥1,925,333 ¥4,063,727 ¥3,888,887 ¥9,877,947
Long-lived assets 1,167,236 2,380,885 802,697 4,350,818
The above information is based on the location of the Company and its subsidiaries.
Supplemental Geographical Information
In addition to the disclosure required by U.S. GAAP, Honda provides the following supplemental information in order to provide
financial statements users with additional useful information:
Supplemental geographical information based on the location of the Company and its subsidiaries
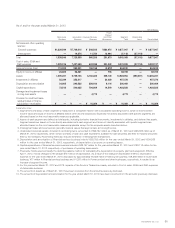
As of and for the year ended March 31, 2012
Yen (millions)
Japan
North
America Europe Asia
Other
Regions Total
Reconciling
Items Consolidated
Net sales and other operating
revenue:
External customers ¥1,774,573 ¥3,500,245 ¥519,329 ¥1,276,621 ¥877,327 ¥ 7,948,095 ¥ — ¥ 7,948,095
Transfers between
geographic areas 1,588,379 214,511 61,463 213,857 15,805 2,094,015 (2,094,015) —
Total 3,362,952 3,714,756 580,792 1,490,478 893,132 10,042,110 (2,094,015) 7,948,095
Cost of sales, SG&A and
R&D expenses 3,472,786 3,491,463 592,901 1,413,608 836,176 9,806,934 (2,090,203) 7,716,731
Operating income (loss) (109,834) 223,293 (12,109) 76,870 56,956 235,176 (3,812) 231,364
Assets 3,112,901 6,333,851 568,790 1,070,331 611,818 11,697,691 89,908 11,787,599
Long-lived assets ¥1,048,402 ¥1,970,631 ¥111,354 ¥ 274,182 ¥130,339 ¥ 3,534,908 ¥ — ¥ 3,534,908
Annual Report 201356