Honda 2013 Annual Report Download - page 64
Download and view the complete annual report
Please find page 64 of the 2013 Honda annual report below. You can navigate through the pages in the report by either clicking on the pages listed below, or by using the keyword search tool below to find specific information within the annual report.-
 1
1 -
2
-
3
-
4
-
5
-
6
-
7
-
8
-
9
-
10
-
11
-
12
-
13
-
14
-
15
-
16
-
17
-
18
-
19
-
20
-
21
-
22
-
23
-
24
-
25
-
26
-
27
-
28
-
29
-
30
-
31
-
32
-
33
-
34
-
35
-
36
-
37
-
38
-
39
-
40
-
41
-
42
-
43
-
44
-
45
-
46
-
47
-
48
-
49
-
50
-
51
-
52
-
53
-
 54
54 -
 55
55 -
 56
56 -
 57
57 -
 58
58 -
 59
59 -
 60
60 -
 61
61 -
 62
62 -
 63
63 -
 64
64 -
 65
65 -
 66
66 -
 67
67 -
 68
68
 |
 |

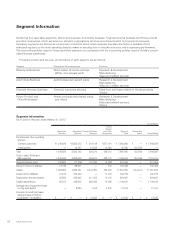
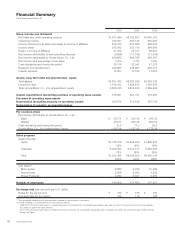
Selected Quarterly Financial Data
Yen (millions except per share amounts)
Fiscal year ended March 31, 2012 Fiscal year ended March 31, 2013
Q1 Q2 Q3 Q4 Q1 Q2 Q3 Q4
Net sales and other operating
revenue ¥1,714,596 ¥1,885,892 ¥1,942,545 ¥2,405,062 ¥2,435,909 ¥2,271,286 ¥2,425,792 ¥2,744,960
Operating income 22,579 52,511 44,298 111,976 176,013 100,867 131,941 135,989
Income before income taxes and
equity in income of affiliates 29,299 76,555 58,492 93,057 194,780 106,260 89,777 98,074
Net income attributable to
Honda Motor Co., Ltd. 31,797 60,429 47,662 71,594 131,723 82,233 77,441 75,752
Basic net income attributable to
Honda Motor Co., Ltd. ¥ 17.64 ¥ 33.53 ¥ 26.45 ¥ 39.72 ¥ 73.09 ¥ 45.63 ¥ 42.97 ¥ 42.03
Tokyo Stock Exchange:
(TSE) (in yen)
High ¥ 3,255 ¥ 3,295 ¥ 2,511 ¥ 3,300 ¥ 3,250 ¥ 2,799 ¥ 3,185 ¥ 3,830
Low 2,843 2,227 2,127 2,393 2,354 2,339 2,294 3,100
New York Stock Exchange:
(NYSE) (in U.S. dollars)
High $ 39.59 $ 41.23 $ 32.65 $ 39.35 $ 38.96 $ 34.81 $ 37.00 $ 40.00
Low 33.76 28.90 27.52 31.11 30.30 28.50 29.26 36.18
Annual Report 201362