Honda 2013 Annual Report Download - page 62
Download and view the complete annual report
Please find page 62 of the 2013 Honda annual report below. You can navigate through the pages in the report by either clicking on the pages listed below, or by using the keyword search tool below to find specific information within the annual report.-
 1
1 -
2
-
3
-
4
-
5
-
6
-
7
-
8
-
9
-
10
-
11
-
12
-
13
-
14
-
15
-
16
-
17
-
18
-
19
-
20
-
21
-
22
-
23
-
24
-
25
-
26
-
27
-
28
-
29
-
30
-
31
-
32
-
33
-
34
-
35
-
36
-
37
-
38
-
39
-
40
-
41
-
42
-
43
-
44
-
45
-
46
-
47
-
48
-
49
-
50
-
51
-
 52
52 -
 53
53 -
 54
54 -
 55
55 -
 56
56 -
 57
57 -
 58
58 -
 59
59 -
 60
60 -
 61
61 -
 62
62 -
 63
63 -
 64
64 -
 65
65 -
 66
66 -
 67
67 -
 68
68
 |
 |
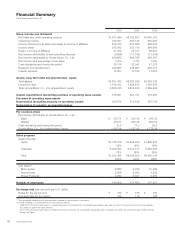
Financial Summary
Fiscal years ended March 31
2003 2004 2005
Sales, income and dividends
Net sales and other operating revenue ¥7,971,499 ¥8,162,600 ¥8,650,105
Operating income 724,527 600,144 630,920
Income before income taxes and equity in income of affiliates 619,413 653,680 668,364
Income taxes 245,065 252,740 266,665
Equity in income of affiliates 61,972 75,151 96,057
Net income attributable to noncontrolling interests (9,658) (11,753) (11,559)
Net income attributable to Honda Motor Co., Ltd. 426,662 464,338 486,197
Net income as a percentage of net sales 5.4% 5.7% 5.6%
Cash dividends paid during the period 30,176 33,541 47,797
Research and development 436,863 448,967 467,754
Interest expense 12,207 10,194 11,655
Assets, long-term debt and shareholders’ equity
Total assets ¥7,821,403 ¥8,380,549 ¥9,368,236
Long-term debt 1,140,182 1,394,612 1,559,500
Total Honda Motor Co., Ltd. shareholders’ equity 2,629,720 2,874,400 3,289,294
Capital expenditures (excluding purchase of operating lease assets) 316,991 287,741 373,980
Purchase of operating lease assets
Depreciation (excluding property on operating leases) 220,874 213,445 225,752
Depreciation of property on operating leases
Per common share
Net income attributable to Honda Motor Co., Ltd.:
Basic ¥ 219.71 ¥ 243.45 ¥ 260.34
Diluted 219.71 243.45 260.34
Cash dividends paid during the period 15.5 17.5 25.5
Honda Motor Co., Ltd. shareholders’ equity 1,367.34 1,527.45 1,778.24
Sales progress
Sales amounts:*1
Japan ¥1,748,706 ¥1,628,493 ¥1,699,205
22% 20% 20%
Overseas 6,222,793 6,534,107 6,950,900
78% 80% 80%
Total ¥7,971,499 ¥8,162,600 ¥8,650,105
100% 100% 100%
Unit sales:*2
Motorcycles 8,080 9,206 10,482
Automobiles 2,888 2,983 3,242
Power Products 4,584 5,047 5,300
Number of employees 126,900 131,600 137,827
Exchange rate (yen amounts per U.S. dollar)
Rates for the period-end ¥ 120 ¥ 106 ¥ 107
Average rates for the period 122 113 108
*1 The geographic breakdown of sales amounts is based on the location of customers.
*2 Honda changed its counting method for unit sales as follows;
· 2003–2010: the total of unit sales of completed products of Honda and its consolidated subsidiaries, and sales of parts for local production at Honda’s affiliates
accounted for under the equity method
· 2011–2013: the total of unit sales of completed products of Honda, its consolidated subsidiaries and its affiliates accounted for under the equity method (Honda
Group Unit Sales)
Annual Report 201360