Home Depot 2015 Annual Report Download - page 68
Download and view the complete annual report
Please find page 68 of the 2015 Home Depot annual report below. You can navigate through the pages in the report by either clicking on the pages listed below, or by using the keyword search tool below to find specific information within the annual report.-
 1
1 -
2
-
3
-
4
-
5
-
6
-
7
-
8
-
9
-
10
-
11
-
12
-
13
-
14
-
15
-
16
-
17
-
18
-
19
-
20
-
21
-
22
-
23
-
24
-
25
-
26
-
27
-
28
-
29
-
30
-
31
-
32
-
33
-
34
-
35
-
36
-
37
-
38
-
39
-
40
-
41
-
42
-
43
-
44
-
45
-
46
-
47
-
48
-
49
-
50
-
51
-
52
-
53
-
54
-
55
-
56
-
57
-
 58
58 -
 59
59 -
 60
60 -
 61
61 -
 62
62 -
 63
63 -
 64
64 -
 65
65 -
 66
66 -
 67
67 -
 68
68 -
 69
69 -
 70
70 -
 71
71 -
 72
72 -
 73
73 -
 74
74 -
 75
75 -
 76
76 -
 77
77 -
 78
78 -
79
-
80
-
81
-
82
-
83
-
84
-
85
-
86
-
87
-
88
-
89
-
90
-
91
 |
 |

Table of Contents
F-1
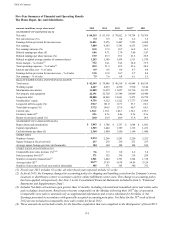
Five-Year Summary of Financial and Operating Results
The Home Depot, Inc. and Subsidiaries
amounts in millions, except where noted 2015 2014 2013 2012(1) 2011
STATEMENT OF EARNINGS DATA
Net sales $ 88,519 $ 83,176 $ 78,812 $ 74,754 $ 70,395
Net sales increase (%) 6.4 5.5 5.4 6.2 3.5
Earnings before provision for income taxes 11,021 9,976 8,467 7,221 6,068
Net earnings 7,009 6,345 5,385 4,535 3,883
Net earnings increase (%) 10.5 17.8 18.7 16.8 16.3
Diluted earnings per share ($) 5.46 4.71 3.76 3.00 2.47
Diluted earnings per share increase (%) 15.9 25.3 25.3 21.5 22.9
Diluted weighted average number of common shares 1,283 1,346 1,434 1,511 1,570
Gross margin – % of sales(2) 34.2 34.1 34.2 34.0 33.9
Total operating expenses – % of sales(2) 20.9 21.5 22.5 23.6 24.4
Interest and other, net – % of sales 0.9 0.6 0.9 0.7 0.8
Earnings before provision for income taxes – % of sales 12.5 12.0 10.7 9.7 8.6
Net earnings – % of sales 7.9 7.6 6.8 6.1 5.5
BALANCE SHEET DATA AND FINANCIAL RATIOS
Total assets $ 42,549 $ 39,946 $ 40,518 $ 41,084 $ 40,518
Working capital 4,467 4,033 4,530 3,910 5,144
Merchandise inventories 11,809 11,079 11,057 10,710 10,325
Net property and equipment 22,191 22,720 23,348 24,069 24,448
Long-term debt 20,888 16,869 14,691 9,475 10,758
Stockholders’ equity 6,316 9,322 12,522 17,777 17,898
Long-term debt-to-equity (%) 330.7 181.0 117.3 53.3 60.1
Total debt-to-equity (%) 337.5 184.5 117.6 60.7 60.3
Current ratio 1.36:1 1.36:1 1.42:1 1.34:1 1.55:1
Inventory turnover(2) 4.9x 4.7x 4.6x 4.5x 4.3x
Return on invested capital (%) 28.0 24.9 20.9 17.0 14.9
STATEMENT OF CASH FLOWS DATA
Depreciation and amortization $ 1,863 $ 1,786 $ 1,757 $ 1,684 $ 1,682
Capital expenditures 1,503 1,442 1,389 1,312 1,221
Cash dividends per share ($) 2.360 1.880 1.560 1.160 1.040
STORE DATA
Number of stores 2,274 2,269 2,263 2,256 2,252
Square footage at fiscal year-end 237 236 236 235 235
Average square footage per store (in thousands) 104 104 104 104 104
STORE SALES AND OTHER DATA
Comparable store sales increase (%)(3)(4) 5.6 5.3 6.8 4.6 3.4
Sales per square foot ($)(4) 371 352 334 319 299
Number of customer transactions(4) 1,501 1,442 1,391 1,364 1,318
Average ticket ($)(4) 58.77 57.87 56.78 54.89 53.28
Number of associates at fiscal year-end (in thousands) 385 371 365 340 331
(1) Fiscal year 2012 includes 53 weeks; all other fiscal years reported include 52 weeks.
(2) In fiscal 2015, the Company changed its accounting policy for shipping and handling costs from the Company’s stores,
locations or distribution centers to customers and for online fulfillment center costs. This change in accounting policy
has been applied retrospectively. See Note 2 to the Consolidated Financial Statements included in Item 8, "Financial
Statements and Supplementary Data".
(3) Includes Net Sales at locations open greater than 12 months, including relocated and remodeled stores and online sales,
and excluding closed stores. Retail stores become comparable on the Monday following their 365th day of operation.
Comparable store sales is intended only as supplemental information and is not a substitute for Net Sales or Net
Earnings presented in accordance with generally accepted accounting principles. Net Sales for the 53rd week of fiscal
2012 are not included in comparable store sales results for fiscal 2012.
(4) These amounts do not include results for the Interline acquisition that was completed in the third quarter of fiscal 2015.