Home Depot 2015 Annual Report Download - page 39
Download and view the complete annual report
Please find page 39 of the 2015 Home Depot annual report below. You can navigate through the pages in the report by either clicking on the pages listed below, or by using the keyword search tool below to find specific information within the annual report.-
 1
1 -
2
-
3
-
4
-
5
-
6
-
7
-
8
-
9
-
10
-
11
-
12
-
13
-
14
-
15
-
16
-
17
-
18
-
19
-
20
-
21
-
22
-
23
-
24
-
25
-
26
-
27
-
28
-
 29
29 -
 30
30 -
 31
31 -
 32
32 -
 33
33 -
 34
34 -
 35
35 -
 36
36 -
 37
37 -
 38
38 -
 39
39 -
 40
40 -
 41
41 -
 42
42 -
 43
43 -
 44
44 -
 45
45 -
 46
46 -
 47
47 -
 48
48 -
 49
49 -
50
-
51
-
52
-
53
-
54
-
55
-
56
-
57
-
58
-
59
-
60
-
61
-
62
-
63
-
64
-
65
-
66
-
67
-
68
-
69
-
70
-
71
-
72
-
73
-
74
-
75
-
76
-
77
-
78
-
79
-
80
-
81
-
82
-
83
-
84
-
85
-
86
-
87
-
88
-
89
-
90
-
91
 |
 |
Table of Contents
37
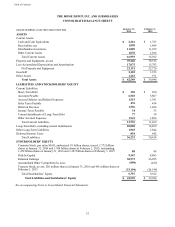
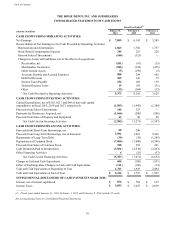
NOTES TO CONSOLIDATED FINANCIAL STATEMENTS
1. SUMMARY OF SIGNIFICANT ACCOUNTING POLICIES
Business, Consolidation and Presentation
The Home Depot, Inc., together with its subsidiaries (the "Company"), is a home improvement retailer that sells a wide
assortment of building materials, home improvement products and lawn and garden products and provides a number of
services. The Home Depot stores, which are full-service, warehouse-style stores averaging approximately 104,000 square feet
of enclosed space, with approximately 24,000 additional square feet of outside garden area, stock approximately 30,000 to
40,000 different kinds of products that are sold to do-it-yourself customers, do-it-for-me customers and professional
customers. The Company also offers a significantly broader product assortment through its Home Depot, Home Decorators
Collection and Blinds.com websites. At the end of fiscal 2015, the Company was operating 2,274 The Home Depot stores,
which included 1,977 stores in the United States, including the Commonwealth of Puerto Rico and the territories of the U.S.
Virgin Islands and Guam ("U.S."), 182 stores in Canada and 115 stores in Mexico. The Consolidated Financial Statements
include the accounts of the Company and its wholly-owned subsidiaries. All significant intercompany transactions have been
eliminated in consolidation.
Fiscal Year
The Company’s fiscal year is a 52- or 53-week period ending on the Sunday nearest to January 31. Fiscal years ended
January 31, 2016 ("fiscal 2015"), February 1, 2015 ("fiscal 2014") and February 2, 2014 ("fiscal 2013") include 52 weeks.
Use of Estimates
Management of the Company has made a number of estimates and assumptions relating to the reporting of assets and
liabilities, the disclosure of contingent assets and liabilities, and reported amounts of revenues and expenses in preparing
these financial statements in conformity with U.S. generally accepted accounting principles. Actual results could differ from
these estimates.
Fair Value of Financial Instruments
The carrying amounts of Cash and Cash Equivalents, Receivables, Short-Term Debt and Accounts Payable approximate fair
value due to the short-term maturities of these financial instruments. The fair value of the Company’s Long-Term Debt is
discussed in Note 11.
Cash Equivalents
The Company considers all highly liquid investments purchased with original maturities of three months or less to be cash
equivalents. The Company’s cash equivalents are carried at fair market value and consist primarily of money market funds.
Accounts Receivable
The Company has an agreement with a third-party service provider who directly extends credit to customers, manages the
Company’s private label credit card program and owns the related receivables. The Company evaluated the third-party
entities holding the receivables under the program and concluded that they should not be consolidated by the Company. The
agreement with the third-party service provider expires in January 2018, with the Company having the option, but no
obligation, to purchase the receivables at the end of the agreement. The deferred interest charges incurred by the Company
for its deferred financing programs offered to its customers are included in Cost of Sales. The interchange fees charged to the
Company for the customers’ use of the cards and any profit sharing with the third-party service provider are included in
Selling, General and Administrative expenses ("SG&A"). The sum of the three is referred to by the Company as "the cost of
credit" of the private label credit card program.
In addition, certain subsidiaries of the Company, including Interline Brands, Inc. ("Interline"), extend credit directly to
customers in the ordinary course of business. The receivables due from customers were $253 million and $68 million as of
January 31, 2016 and February 1, 2015, respectively. The Company’s valuation reserve related to accounts receivable was not
material to the Consolidated Financial Statements of the Company as of the end of fiscal 2015 or 2014.
Merchandise Inventories
The majority of the Company’s Merchandise Inventories are stated at the lower of cost (first-in, first-out) or market, as
determined by the retail inventory method. As the inventory retail value is adjusted regularly to reflect market conditions, the
inventory valued using the retail method approximates the lower of cost or market. Certain subsidiaries, including retail