Home Depot 2015 Annual Report Download - page 25
Download and view the complete annual report
Please find page 25 of the 2015 Home Depot annual report below. You can navigate through the pages in the report by either clicking on the pages listed below, or by using the keyword search tool below to find specific information within the annual report.-
 1
1 -
2
-
3
-
4
-
5
-
6
-
7
-
8
-
9
-
10
-
11
-
12
-
13
-
14
-
 15
15 -
 16
16 -
 17
17 -
 18
18 -
 19
19 -
 20
20 -
 21
21 -
 22
22 -
 23
23 -
 24
24 -
 25
25 -
 26
26 -
 27
27 -
 28
28 -
 29
29 -
 30
30 -
 31
31 -
 32
32 -
 33
33 -
 34
34 -
 35
35 -
36
-
37
-
38
-
39
-
40
-
41
-
42
-
43
-
44
-
45
-
46
-
47
-
48
-
49
-
50
-
51
-
52
-
53
-
54
-
55
-
56
-
57
-
58
-
59
-
60
-
61
-
62
-
63
-
64
-
65
-
66
-
67
-
68
-
69
-
70
-
71
-
72
-
73
-
74
-
75
-
76
-
77
-
78
-
79
-
80
-
81
-
82
-
83
-
84
-
85
-
86
-
87
-
88
-
89
-
90
-
91
 |
 |
Table of Contents
23
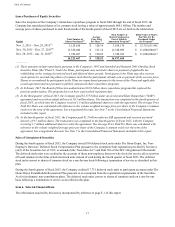
Diluted Earnings per Share
Diluted Earnings per Share were $5.46 for fiscal 2015 compared to $4.71 for fiscal 2014. Expenses related to the Data Breach
had a negative impact of $0.06 to Diluted Earnings per Share for fiscal 2015 compared to a negative impact of $0.02 for
fiscal 2014. The gains on the sales of our equity ownership in HD Supply contributed a benefit of $0.07 to Diluted Earnings
per Share for fiscal 2015 compared to a benefit of $0.15 for fiscal 2014.
Fiscal 2014 Compared to Fiscal 2013
Net Sales
Net Sales for fiscal 2014 increased 5.5% to $83.2 billion from $78.8 billion for fiscal 2013. The increase in Net Sales for
fiscal 2014 reflects the impact of positive comparable store sales driven by increased customer transactions and average ticket
growth. Total comparable store sales increased 5.3% for fiscal 2014.
The positive comparable store sales for fiscal 2014 reflect a number of factors, including the execution of our key initiatives,
continued strength in our maintenance and repair categories, and an improved U.S. home improvement market. All of our
departments posted positive comparable store sales for fiscal 2014. Comparable store sales for our Tools, Appliances,
Millwork, Décor, Plumbing, Lighting, Electrical and Hardware product categories were above or at the Company average for
fiscal 2014. Further, our comparable store customer transactions increased 3.5% for fiscal 2014 and comparable store average
ticket increased 1.8% for fiscal 2014, due in part to strong sales in big ticket purchases, such as appliances and water heaters,
and sales growth in our services business.
Gross Profit
Gross Profit increased 5.5% to $28.4 billion for fiscal 2014 from $26.9 billion for fiscal 2013. Gross Profit as a percent of
Net Sales, or gross profit margin, was 34.1% for fiscal 2014 compared to 34.2% for fiscal 2013, a decrease of 2 basis points.
The decrease in gross profit margin for fiscal 2014 was driven primarily by higher shrink, partially offset by benefits from
productivity in our supply chain.
Operating Expenses
SG&A increased 1.0% to $16.3 billion for fiscal 2014 from $16.1 billion for fiscal 2013. SG&A for fiscal 2014 included $33
million of pretax net expenses related to the Data Breach. As a percent of Net Sales, SG&A was 19.6% for fiscal 2014
compared to 20.5% for fiscal 2013. The decrease in SG&A as a percent of Net Sales for fiscal 2014 reflects expense leverage
resulting from the positive comparable store sales environment and strong expense controls, partially offset by expenses
related to the Data Breach.
Depreciation and Amortization was $1.6 billion for both fiscal 2014 and 2013. Depreciation and Amortization as a percent of
Net Sales was 2.0% for fiscal 2014 compared to 2.1% for fiscal 2013. The decrease in Depreciation and Amortization as a
percent of Net Sales for fiscal 2014 reflects expense leverage resulting from the positive comparable store sales environment.
Operating Income
Operating Income increased 14.2% to $10.5 billion for fiscal 2014 from $9.2 billion for fiscal 2013. Operating Income as a
percent of Net Sales was 12.6% for fiscal 2014 compared to 11.6% for fiscal 2013.
Interest and Other, net
In fiscal 2014, we recognized $493 million of Interest and Other, net, compared to $699 million for fiscal 2013. Interest and
Other, net, as a percent of Net Sales was 0.6% for fiscal 2014 compared to 0.9% for fiscal 2013. Interest and Other, net, for
fiscal 2014 included a $323 million pretax gain related to the sales of portions of our equity ownership in HD Supply. This
was partially offset by additional interest expense associated with $2.0 billion of long-term debt issued in June 2014.
Provision for Income Taxes
Our combined effective income tax rate was 36.4% for both fiscal 2014 and 2013.
Diluted Earnings per Share
Diluted Earnings per Share were $4.71 for fiscal 2014 compared to $3.76 for fiscal 2013. Diluted Earnings per Share for
fiscal 2014 reflect $0.15 of benefit from the gain related to the sales of portions of our equity ownership in HD Supply and a
negative impact of $0.02 for expenses incurred in connection with the Data Breach.