Home Depot 2015 Annual Report Download - page 24
Download and view the complete annual report
Please find page 24 of the 2015 Home Depot annual report below. You can navigate through the pages in the report by either clicking on the pages listed below, or by using the keyword search tool below to find specific information within the annual report.-
 1
1 -
2
-
3
-
4
-
5
-
6
-
7
-
8
-
9
-
10
-
11
-
12
-
13
-
 14
14 -
 15
15 -
 16
16 -
 17
17 -
 18
18 -
 19
19 -
 20
20 -
 21
21 -
 22
22 -
 23
23 -
 24
24 -
 25
25 -
 26
26 -
 27
27 -
 28
28 -
 29
29 -
 30
30 -
 31
31 -
 32
32 -
 33
33 -
 34
34 -
35
-
36
-
37
-
38
-
39
-
40
-
41
-
42
-
43
-
44
-
45
-
46
-
47
-
48
-
49
-
50
-
51
-
52
-
53
-
54
-
55
-
56
-
57
-
58
-
59
-
60
-
61
-
62
-
63
-
64
-
65
-
66
-
67
-
68
-
69
-
70
-
71
-
72
-
73
-
74
-
75
-
76
-
77
-
78
-
79
-
80
-
81
-
82
-
83
-
84
-
85
-
86
-
87
-
88
-
89
-
90
-
91
 |
 |

Table of Contents
22
Results of Operations
The following discussion should be read in conjunction with the Consolidated Financial Statements and the Notes to
Consolidated Financial Statements presented in this report.
Fiscal 2015 Compared to Fiscal 2014
Net Sales
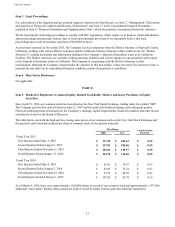
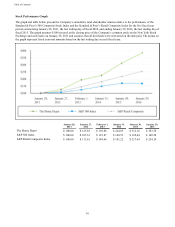
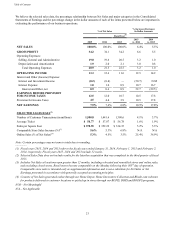
Net Sales for fiscal 2015 increased 6.4% to $88.5 billion from $83.2 billion for fiscal 2014. The increase in Net Sales for
fiscal 2015 reflects the impact of positive comparable store sales driven by increased customer transactions and average ticket
growth, partially offset by pressure from the strengthening U.S. dollar. Total comparable store sales increased 5.6% for fiscal
2015.
The positive comparable store sales for fiscal 2015 reflect a number of factors, including the execution of our key initiatives,
an improved U.S. home improvement market and broad-based growth across our stores. All of our departments posted
positive comparable store sales for fiscal 2015. Comparable store sales for our Tools, Appliances, Plumbing, Décor, Lighting,
Indoor Garden, Building Materials and Hardware product categories were above the Company average for fiscal 2015.
Further, our comparable store customer transactions increased 4.0% for fiscal 2015 and comparable store average ticket
increased 1.6% for fiscal 2015, due in part to strong sales in big ticket purchases such as appliances, roofing and several
installation service categories, offset in part by the strength of the U.S. dollar.
Gross Profit
Gross Profit increased 6.6% to $30.3 billion for fiscal 2015 from $28.4 billion for fiscal 2014. Gross Profit as a percent of
Net Sales, or gross profit margin, was 34.2% for fiscal 2015 compared to 34.1% for fiscal 2014, an increase of 6 basis points.
The increase in gross profit margin for fiscal 2015 reflects benefits from our supply chain driven by lower fuel costs and
increased productivity, partially offset by a change in the mix of products sold and the impact of Interline, which has a lower
gross profit margin.
Operating Expenses
SG&A increased 3.2% to $16.8 billion for fiscal 2015 from $16.3 billion for fiscal 2014. SG&A for fiscal 2015 included
$128 million of pretax net expenses related to the Data Breach compared to $33 million of pretax net expenses for fiscal
2014. As a percent of Net Sales, SG&A was 19.0% for fiscal 2015 compared to 19.6% for fiscal 2014. The decrease in SG&A
as a percent of Net Sales for fiscal 2015 reflects strong expense controls and expense leverage resulting from the positive
comparable store sales environment, partially offset by expenses related to the Data Breach.
Depreciation and Amortization increased 3.0% to $1.7 billion for fiscal 2015 from $1.6 billion for fiscal 2014. Depreciation
and Amortization as a percent of Net Sales was 1.9% for fiscal 2015 compared to 2.0% for fiscal 2014. The decrease in
Depreciation and Amortization as a percent of Net Sales for fiscal 2015 reflects expense leverage resulting from the positive
comparable store sales environment.
Operating Income
Operating Income increased 12.5% to $11.8 billion for fiscal 2015 from $10.5 billion for fiscal 2014. Operating Income as a
percent of Net Sales was 13.3% for fiscal 2015 compared to 12.6% for fiscal 2014.
Interest and Other, net
In fiscal 2015, we recognized $753 million of Interest and Other, net, compared to $493 million for fiscal 2014. Interest and
Other, net, as a percent of Net Sales was 0.9% for fiscal 2015 compared to 0.6% for fiscal 2014. These results include a $144
million pretax gain in fiscal 2015 related to the sale of our remaining equity ownership in HD Supply compared to a pretax
gain of $323 million in fiscal 2014 related to the sales of portions of our equity ownership in HD Supply. Interest and Other,
net, for fiscal 2015 also reflects additional interest expense associated with $4.0 billion of long-term debt issued in fiscal
2015.
Provision for Income Taxes
Our combined effective income tax rate was 36.4% for both fiscal 2015 and 2014.