Home Depot 2015 Annual Report Download - page 23
Download and view the complete annual report
Please find page 23 of the 2015 Home Depot annual report below. You can navigate through the pages in the report by either clicking on the pages listed below, or by using the keyword search tool below to find specific information within the annual report.-
 1
1 -
2
-
3
-
4
-
5
-
6
-
7
-
8
-
9
-
10
-
11
-
12
-
 13
13 -
 14
14 -
 15
15 -
 16
16 -
 17
17 -
 18
18 -
 19
19 -
 20
20 -
 21
21 -
 22
22 -
 23
23 -
 24
24 -
 25
25 -
 26
26 -
 27
27 -
 28
28 -
 29
29 -
 30
30 -
 31
31 -
 32
32 -
 33
33 -
34
-
35
-
36
-
37
-
38
-
39
-
40
-
41
-
42
-
43
-
44
-
45
-
46
-
47
-
48
-
49
-
50
-
51
-
52
-
53
-
54
-
55
-
56
-
57
-
58
-
59
-
60
-
61
-
62
-
63
-
64
-
65
-
66
-
67
-
68
-
69
-
70
-
71
-
72
-
73
-
74
-
75
-
76
-
77
-
78
-
79
-
80
-
81
-
82
-
83
-
84
-
85
-
86
-
87
-
88
-
89
-
90
-
91
 |
 |

Table of Contents
21
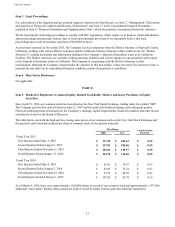
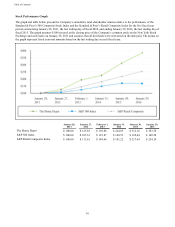
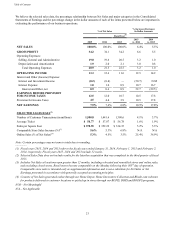
We believe the selected sales data, the percentage relationship between Net Sales and major categories in the Consolidated
Statements of Earnings and the percentage change in the dollar amounts of each of the items presented below are important in
evaluating the performance of our business operations.
% of Net Sales % Increase (Decrease)
In Dollar Amounts
Fiscal Year(1)
2015 2014 2013 2015
vs. 2014 2014
vs. 2013
NET SALES 100.0% 100.0% 100.0% 6.4% 5.5%
GROSS PROFIT 34.2 34.1 34.2 6.6 5.5
Operating Expenses:
Selling, General and Administrative 19.0 19.6 20.5 3.2 1.0
Depreciation and Amortization 1.9 2.0 2.1 3.0 0.8
Total Operating Expenses 20.9 21.5 22.5 3.2 1.0
OPERATING INCOME 13.3 12.6 11.6 12.5 14.2
Interest and Other (Income) Expense:
Interest and Investment Income (0.2) (0.4) — (50.7) N/M
Interest Expense 1.0 1.0 0.9 10.7 16.7
Interest and Other, net 0.9 0.6 0.9 52.7 (29.5)
EARNINGS BEFORE PROVISION
FOR INCOME TAXES 12.5 12.0 10.7 10.5 17.8
Provision for Income Taxes 4.5 4.4 3.9 10.5 17.8
NET EARNINGS 7.9% 7.6% 6.8% 10.5% 17.8%
SELECTED SALES DATA(2)
Number of Customer Transactions (in millions) 1,500.8 1,441.6 1,390.6 4.1% 3.7%
Average Ticket $ 58.77 $ 57.87 $ 56.78 1.6% 1.9%
Sales per Square Foot $ 370.55 $ 352.22 $ 334.35 5.2% 5.3%
Comparable Store Sales Increase (%)(3) 5.6% 5.3% 6.8% N/A N/A
Online Sales (% of Net Sales)(4) 5.3% 4.5% 3.5% 25.4% 36.9%
Note: Certain percentages may not sum to totals due to rounding.
—————
(1) Fiscal years 2015, 2014 and 2013 refer to the fiscal years ended January 31, 2016, February 1, 2015 and February 2,
2014, respectively. Fiscal years 2015, 2014 and 2013 include 52 weeks.
(2) Selected Sales Data does not include results for the Interline acquisition that was completed in the third quarter of fiscal
2015.
(3) Includes Net Sales at locations open greater than 12 months, including relocated and remodeled stores and online sales,
and excluding closed stores. Retail stores become comparable on the Monday following their 365th day of operation.
Comparable store sales is intended only as supplemental information and is not a substitute for Net Sales or Net
Earnings presented in accordance with generally accepted accounting principles.
(4) Consists of Net Sales generated online through our Home Depot, Home Decorators Collection and Blinds.com websites
for products delivered to customer locations or picked up in stores through our BOPIS, BOSS and BODFS programs.
N/M – Not Meaningful
N/A – Not Applicable