Home Depot 2015 Annual Report Download - page 59
Download and view the complete annual report
Please find page 59 of the 2015 Home Depot annual report below. You can navigate through the pages in the report by either clicking on the pages listed below, or by using the keyword search tool below to find specific information within the annual report.-
 1
1 -
2
-
3
-
4
-
5
-
6
-
7
-
8
-
9
-
10
-
11
-
12
-
13
-
14
-
15
-
16
-
17
-
18
-
19
-
20
-
21
-
22
-
23
-
24
-
25
-
26
-
27
-
28
-
29
-
30
-
31
-
32
-
33
-
34
-
35
-
36
-
37
-
38
-
39
-
40
-
41
-
42
-
43
-
44
-
45
-
46
-
47
-
48
-
 49
49 -
 50
50 -
 51
51 -
 52
52 -
 53
53 -
 54
54 -
 55
55 -
 56
56 -
 57
57 -
 58
58 -
 59
59 -
 60
60 -
 61
61 -
 62
62 -
 63
63 -
 64
64 -
 65
65 -
 66
66 -
 67
67 -
 68
68 -
 69
69 -
70
-
71
-
72
-
73
-
74
-
75
-
76
-
77
-
78
-
79
-
80
-
81
-
82
-
83
-
84
-
85
-
86
-
87
-
88
-
89
-
90
-
91
 |
 |

Table of Contents
57
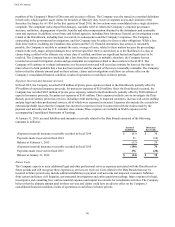
Insurance Coverage
The Company maintained $100 million of network security and privacy liability insurance coverage in fiscal 2014, above a
$7.5 million deductible, to limit the Company’s exposure to losses such as those related to the Data Breach. As of January 31,
2016, the Company had received initial payments totaling $30 million of insurance reimbursements under the fiscal 2014
policy, and expects to receive additional payments. The Company maintained $100 million of network security and privacy
liability insurance coverage in fiscal 2015, above a $10 million deductible, to limit the Company’s exposure to similar losses.
In the first quarter of fiscal 2016, the Company entered into a new policy, with $100 million of network security and privacy
liability insurance coverage, above a $10 million deductible, to limit the Company’s exposure to similar losses.
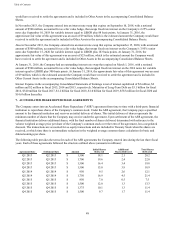
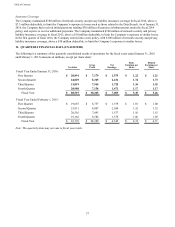
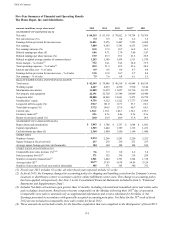
14. QUARTERLY FINANCIAL DATA (UNAUDITED)
The following is a summary of the quarterly consolidated results of operations for the fiscal years ended January 31, 2016
and February 1, 2015 (amounts in millions, except per share data):
Net Sales Gross
Profit Net
Earnings
Basic
Earnings per
Share
Diluted
Earnings per
Share
Fiscal Year Ended January 31, 2016:
First Quarter $ 20,891 $ 7,179 $ 1,579 $ 1.22 $ 1.21
Second Quarter 24,829 8,365 2,234 1.74 1.73
Third Quarter 21,819 7,565 1,725 1.36 1.35
Fourth Quarter 20,980 7,156 1,471 1.17 1.17
Fiscal Year $ 88,519 $ 30,265 $ 7,009 $ 5.49 $ 5.46
Fiscal Year Ended February 1, 2015:
First Quarter $ 19,687 $ 6,757 $ 1,379 $ 1.01 $ 1.00
Second Quarter 23,811 8,007 2,050 1.52 1.52
Third Quarter 20,516 7,043 1,537 1.16 1.15
Fourth Quarter 19,162 6,582 1,379 1.06 1.05
Fiscal Year $ 83,176 $ 28,389 $ 6,345 $ 4.74 $ 4.71
Note: The quarterly data may not sum to fiscal year totals.