Home Depot 2015 Annual Report Download - page 55
Download and view the complete annual report
Please find page 55 of the 2015 Home Depot annual report below. You can navigate through the pages in the report by either clicking on the pages listed below, or by using the keyword search tool below to find specific information within the annual report.-
 1
1 -
2
-
3
-
4
-
5
-
6
-
7
-
8
-
9
-
10
-
11
-
12
-
13
-
14
-
15
-
16
-
17
-
18
-
19
-
20
-
21
-
22
-
23
-
24
-
25
-
26
-
27
-
28
-
29
-
30
-
31
-
32
-
33
-
34
-
35
-
36
-
37
-
38
-
39
-
40
-
41
-
42
-
43
-
44
-
 45
45 -
 46
46 -
 47
47 -
 48
48 -
 49
49 -
 50
50 -
 51
51 -
 52
52 -
 53
53 -
 54
54 -
 55
55 -
 56
56 -
 57
57 -
 58
58 -
 59
59 -
 60
60 -
 61
61 -
 62
62 -
 63
63 -
 64
64 -
 65
65 -
66
-
67
-
68
-
69
-
70
-
71
-
72
-
73
-
74
-
75
-
76
-
77
-
78
-
79
-
80
-
81
-
82
-
83
-
84
-
85
-
86
-
87
-
88
-
89
-
90
-
91
 |
 |

Table of Contents
53
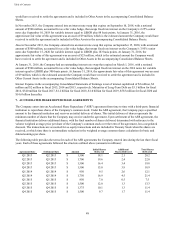
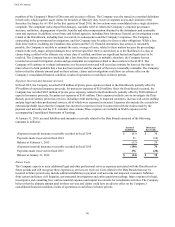
The following table summarizes stock options outstanding at January 31, 2016, February 1, 2015 and February 2, 2014, and
changes during the fiscal years ended on these dates (shares in thousands):
Number of
Shares
Weighted
Average Exercise
Price
Outstanding at February 3, 2013 16,617 $ 34.23
Granted 1,704 69.91
Exercised (4,240) 31.71
Canceled (122) 43.80
Outstanding at February 2, 2014 13,959 $ 39.26
Granted 1,912 81.84
Exercised (4,387) 32.41
Canceled (439) 56.26
Outstanding at February 1, 2015 11,045 $ 48.68
Granted 1,236 116.20
Exercised (2,578) 37.53
Canceled (237) 71.26
Outstanding at January 31, 2016 9,466 $ 59.97
The total intrinsic value of stock options exercised was $206 million, $234 million and $181 million in fiscal 2015, 2014 and
2013, respectively. As of January 31, 2016, there were approximately 9 million stock options outstanding with a weighted
average remaining life of six years and an intrinsic value of $623 million. As of January 31, 2016, there were approximately 4
million stock options exercisable with a weighted average exercise price of $36.48, a weighted average remaining life of four
years, and an intrinsic value of $347 million. As of January 31, 2016, there were approximately 8 million stock options vested
or expected to ultimately vest. As of January 31, 2016, there was $37 million of unamortized stock-based compensation
expense related to stock options, which is expected to be recognized over a weighted average period of two years.
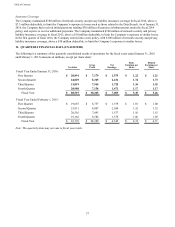
The following table summarizes restricted stock and performance shares outstanding at January 31, 2016, February 1, 2015
and February 2, 2014, and changes during the fiscal years ended on these dates (shares in thousands):
Number of
Shares
Weighted
Average Grant
Date Fair Value
Outstanding at February 3, 2013 13,239 $ 37.18
Granted 3,092 68.44
Restrictions lapsed (5,048) 30.67
Canceled (827) 46.53
Outstanding at February 2, 2014 10,456 $ 48.82
Granted 2,963 76.71
Restrictions lapsed (4,119) 39.90
Canceled (804) 59.55
Outstanding at February 1, 2015 8,496 $ 61.86
Granted 2,102 111.18
Restrictions lapsed (3,311) 51.83
Canceled (600) 77.70
Outstanding at January 31, 2016 6,687 $ 80.90
As of January 31, 2016, there was $305 million of unamortized stock-based compensation expense related to restricted stock
and performance shares, which is expected to be recognized over a weighted average period of two years. The total fair value
of restricted stock and performance shares vesting during fiscal 2015, 2014 and 2013 was $382 million, $334 million and
$353 million, respectively.