Home Depot 2015 Annual Report Download - page 56
Download and view the complete annual report
Please find page 56 of the 2015 Home Depot annual report below. You can navigate through the pages in the report by either clicking on the pages listed below, or by using the keyword search tool below to find specific information within the annual report.-
 1
1 -
2
-
3
-
4
-
5
-
6
-
7
-
8
-
9
-
10
-
11
-
12
-
13
-
14
-
15
-
16
-
17
-
18
-
19
-
20
-
21
-
22
-
23
-
24
-
25
-
26
-
27
-
28
-
29
-
30
-
31
-
32
-
33
-
34
-
35
-
36
-
37
-
38
-
39
-
40
-
41
-
42
-
43
-
44
-
45
-
 46
46 -
 47
47 -
 48
48 -
 49
49 -
 50
50 -
 51
51 -
 52
52 -
 53
53 -
 54
54 -
 55
55 -
 56
56 -
 57
57 -
 58
58 -
 59
59 -
 60
60 -
 61
61 -
 62
62 -
 63
63 -
 64
64 -
 65
65 -
 66
66 -
67
-
68
-
69
-
70
-
71
-
72
-
73
-
74
-
75
-
76
-
77
-
78
-
79
-
80
-
81
-
82
-
83
-
84
-
85
-
86
-
87
-
88
-
89
-
90
-
91
 |
 |

Table of Contents
54
10. EMPLOYEE BENEFIT PLANS
The Company maintains active defined contribution retirement plans for its employees (the "Benefit Plans"). All associates
satisfying certain service requirements are eligible to participate in the Benefit Plans. The Company makes cash contributions
each payroll period up to specified percentages of associates’ contributions as approved by the Board of Directors.
The Company also maintains a restoration plan to provide certain associates deferred compensation that they would have
received under the Benefit Plans as a matching contribution if not for the maximum compensation limits under the Internal
Revenue Code. The Company funds the restoration plan through contributions made to a grantor trust, which are then used to
purchase shares of the Company’s common stock in the open market.
The Company’s contributions to the Benefit Plans and the restoration plan were $186 million, $182 million and $184 million
for fiscal 2015, 2014 and 2013, respectively. At January 31, 2016, the Benefit Plans and the restoration plan held a total of 9
million shares of the Company’s common stock in trust for plan participants.
11. FAIR VALUE MEASUREMENTS
The fair value of an asset is considered to be the price at which the asset could be sold in an orderly transaction between
unrelated knowledgeable and willing parties. A liability’s fair value is defined as the amount that would be paid to transfer the
liability to a new obligor, rather than the amount that would be paid to settle the liability with the creditor. Assets and
liabilities recorded at fair value are measured using a three-tier fair value hierarchy, which prioritizes the inputs used in
measuring fair value. These tiers are:
• Level 1 – Observable inputs that reflect quoted prices in active markets
• Level 2 – Inputs other than quoted prices in active markets that are either directly or indirectly observable
• Level 3 – Unobservable inputs in which little or no market data exists, therefore requiring the Company to
develop its own assumptions
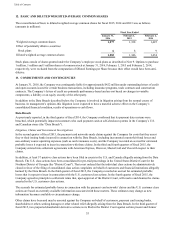
Assets and Liabilities Measured at Fair Value on a Recurring Basis
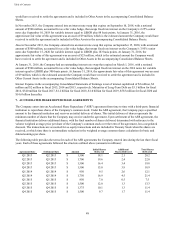
The assets and liabilities of the Company that are measured at fair value on a recurring basis as of January 31, 2016 and
February 1, 2015 were as follows (amounts in millions):
Fair Value at January 31, 2016 Using Fair Value at February 1, 2015 Using
Level 1 Level 2 Level 3 Level 1 Level 2 Level 3
Derivative agreements - assets $ — $ 213 $ — $ — $ 124 $ —
Derivative agreements - liabilities — (82) — ———
Total $ — $ 131 $ — $ — $ 124 $ —
The Company uses derivative financial instruments from time to time in the management of its interest rate exposure on
long-term debt and its exposure on foreign currency fluctuations. The fair value of the Company’s derivative financial
instruments was measured using level 2 inputs. The Company’s derivative agreements are discussed further in Note 6.
Assets and Liabilities Measured at Fair Value on a Nonrecurring Basis
Long-lived assets, goodwill and other intangible assets were analyzed for impairment on a nonrecurring basis using fair value
measurements with unobservable inputs (level 3). Impairment charges related to long-lived assets, goodwill and other
intangible assets in fiscal 2015 and 2014 were not material, as further discussed in Note 1 under the captions "Impairment of
Long-Lived Assets" and "Goodwill and Other Intangible Assets", respectively.
The estimated fair values of the assets acquired and liabilities assumed at the date of acquisition for Interline were measured
using unobservable inputs (level 3). See Note 3 for further discussion of the Interline acquisition.
The aggregate fair value of the Company’s senior notes, based on quoted market prices, was $21.8 billion and $19.0 billion at
January 31, 2016 and February 1, 2015, respectively, compared to a carrying value of $20.2 billion and $16.2 billion at
January 31, 2016 and February 1, 2015, respectively.