GE 2010 Annual Report Download - page 88
Download and view the complete annual report
Please find page 88 of the 2010 GE annual report below. You can navigate through the pages in the report by either clicking on the pages listed below, or by using the keyword search tool below to find specific information within the annual report.-
 1
1 -
2
-
3
-
4
-
5
-
6
-
7
-
8
-
9
-
10
-
11
-
12
-
13
-
14
-
15
-
16
-
17
-
18
-
19
-
20
-
21
-
22
-
23
-
24
-
25
-
26
-
27
-
28
-
29
-
30
-
31
-
32
-
33
-
34
-
35
-
36
-
37
-
38
-
39
-
40
-
41
-
42
-
43
-
44
-
45
-
46
-
47
-
48
-
49
-
50
-
51
-
52
-
53
-
54
-
55
-
56
-
57
-
58
-
59
-
60
-
61
-
62
-
63
-
64
-
65
-
66
-
67
-
68
-
69
-
70
-
71
-
72
-
73
-
74
-
75
-
76
-
77
-
 78
78 -
 79
79 -
 80
80 -
 81
81 -
 82
82 -
 83
83 -
 84
84 -
 85
85 -
 86
86 -
 87
87 -
 88
88 -
 89
89 -
 90
90 -
 91
91 -
 92
92 -
 93
93 -
 94
94 -
 95
95 -
 96
96 -
 97
97 -
 98
98 -
99
-
100
-
101
-
102
-
103
-
104
-
105
-
106
-
107
-
108
-
109
-
110
-
111
-
112
-
113
-
114
-
115
-
116
-
117
-
118
-
119
-
120
-
121
-
122
-
123
-
124
-
125
-
126
-
127
-
128
-
129
-
130
-
131
-
132
-
133
-
134
-
135
-
136
-
137
-
138
-
139
-
140
 |
 |

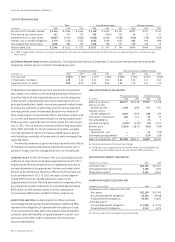
86 GE 2010 ANNUAL REPORT
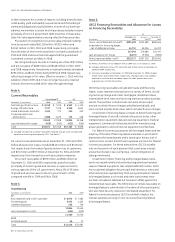
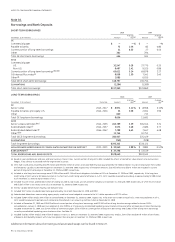
Note 6.
GECS Financing Receivables and Allowance for Losses
on Financing Receivables
At
December 31, January 1, December 31,
(In millions) 2010 2010 (a) 2009
Loans, net of deferred income
(b) $281,639 $321,589 $280,465
Investment in financing leases,
net of deferred income 45,710 55,096 54,332
327,349 376,685 334,797
Less allowance for losses (8,072) (9,556) (7,856)
Financing receivables—net
(c) $319,277 $367,129 $326,941
(a) Reflects the effects of our adoption of ASU 2009-16 & 17 on January 1, 2010.
(b) Excludes deferred income of $2,328 million and $2,338 million at December 31,
2010 and 2009, respectively.
(c) Financing receivables at December 31, 2010 and December 31, 2009 included
$1,503 million and $2,635 million, respectively, relating to loans that had been
acquired in a transfer but have been subject to credit deterioration since
origination per ASC 310, Receivables.
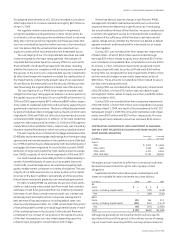
GECS financing receivables include both loans and financing
leases. Loans represent transactions in a variety of forms, includ-
ing revolving charge and credit, mortgages, installment loans,
intermediate-term loans and revolving loans secured by business
assets. The portfolio includes loans carried at the principal
amount on which finance charges are billed periodically, and
loans carried at gross book value, which includes finance charges.
Investment in financing leases consists of direct financing and
leveraged leases of aircraft, railroad rolling stock, autos, other
transportation equipment, data processing equipment, medical
equipment, commercial real estate and other manufacturing,
power generation, and commercial equipment and facilities.
For federal income tax purposes, the leveraged leases and the
majority of the direct financing leases are leases in which GECS
depreciates the leased assets and is taxed upon the accrual of
rental income. Certain direct financing leases are loans for federal
income tax purposes. For these transactions, GECS is taxable
only on the portion of each payment that constitutes interest,
unless the interest is tax-exempt (e.g., certain obligations of
state governments).
Investment in direct financing and leveraged leases repre-
sents net unpaid rentals and estimated unguaranteed residual
values of leased equipment, less related deferred income. GECS
has no general obligation for principal and interest on notes and
other instruments representing third-party participation related
to leveraged leases; such notes and other instruments have
not been included in liabilities but have been offset against the
related rentals receivable. The GECS share of rentals receivable on
leveraged leases is subordinate to the share of other participants
who also have security interests in the leased equipment. For
federal income tax purposes, GECS is entitled to deduct the
interest expense accruing on non-recourse financing related
to leveraged leases.
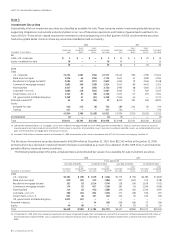
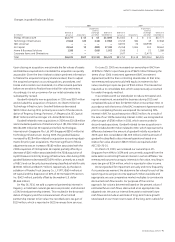
to their maturities for a variety of reasons, including diversification,
credit quality, yield and liquidity requirements and the funding of
claims and obligations to policyholders. In some of our bank sub-
sidiaries, we maintain a certain level of purchases and sales volume
principally of non-U.S. government debt securities. In these situa-
tions, fair value approximates carrying value for these securities.
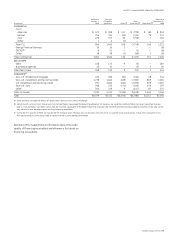
Proceeds from investment securities sales and early redemp-
tions by issuers totaled $16,238 million, $7,823 million and
$3,942 million in 2010, 2009 and 2008, respectively, principally
from the sales of short-term securities in our bank subsidiaries in
2010 and 2009 and securities that supported the guaranteed
investment contract portfolio in 2008.
We recognized a pre-tax loss on trading securities of $7 million
and pre-tax gains of $408 million and $108 million in 2010, 2009
and 2008, respectively. Investments in retained interests decreased
$291 million and $113 million during 2009 and 2008, respectively,
reflecting changes in fair value. Effective January 1, 2010, with the
adoption of ASU 2009-16 & 17, we no longer have any retained
interests that are recorded at fair value through earnings.
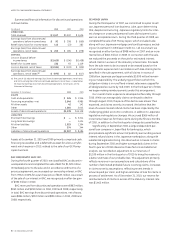
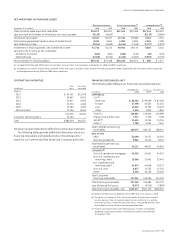
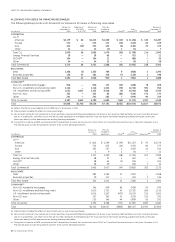
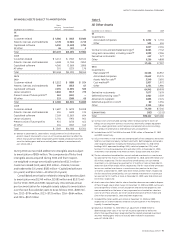
Note 4.
Current Receivables
Consolidated
(a) GE
December 31 (In millions) 2010 2009 2010 2009
Technology Infrastructure $ 8,158 $ 7,226 $ 4,502 $ 4,110
Energy Infrastructure 7,377 7,328 5,349 5,641
Home & Business Solutions 1,426 775 240 209
Corporate items and
eliminations 2,088 1,679 713 408
19,049 17,008 10,804 10,368
Less allowance for losses (428) (550) (421) (550)
Total $18,621 $16,458 $10,383 $ 9,818
(a) Included GE industrial customer receivables factored through a GECS affiliate and
reported as financing receivables by GECS. See Note 27.
GE current receivables balances at December 31, 2010 and 2009,
before allowance for losses, included $8,134 million and $7,455 mil-
lion, respectively, from sales of goods and services to customers,
and $24 million and $37 million at December 31, 2010 and 2009,
respectively, from transactions with asso cia ted companies.
GE current receivables of $193 million and $104 million at
December 31, 2010 and 2009, respectively, arose from sales,
principally of Aviation goods and services, on open account to
various agencies of the U.S. government. About 5% of GE sales
of goods and services were to the U.S. government in 2010,
compared with 6% in 2009 and 5% in 2008.
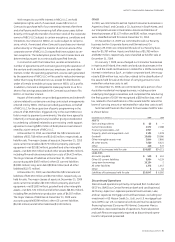
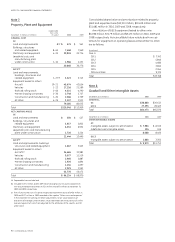
Note 5.
Inventories
December 31 (In millions) 2010 2009
GE
Raw materials and work in process $ 6,973 $ 7,581
Finished goods 4,435 4,105
Unbilled shipments 456 759
11,864 12,445
Less revaluation to LIFO (404) (529)
11,460 11,916
GECS
Finished goods 66 71
Total $11,526 $11,987