GE 2010 Annual Report Download - page 108
Download and view the complete annual report
Please find page 108 of the 2010 GE annual report below. You can navigate through the pages in the report by either clicking on the pages listed below, or by using the keyword search tool below to find specific information within the annual report.-
 1
1 -
2
-
3
-
4
-
5
-
6
-
7
-
8
-
9
-
10
-
11
-
12
-
13
-
14
-
15
-
16
-
17
-
18
-
19
-
20
-
21
-
22
-
23
-
24
-
25
-
26
-
27
-
28
-
29
-
30
-
31
-
32
-
33
-
34
-
35
-
36
-
37
-
38
-
39
-
40
-
41
-
42
-
43
-
44
-
45
-
46
-
47
-
48
-
49
-
50
-
51
-
52
-
53
-
54
-
55
-
56
-
57
-
58
-
59
-
60
-
61
-
62
-
63
-
64
-
65
-
66
-
67
-
68
-
69
-
70
-
71
-
72
-
73
-
74
-
75
-
76
-
77
-
78
-
79
-
80
-
81
-
82
-
83
-
84
-
85
-
86
-
87
-
88
-
89
-
90
-
91
-
92
-
93
-
94
-
95
-
96
-
97
-
 98
98 -
 99
99 -
 100
100 -
 101
101 -
 102
102 -
 103
103 -
 104
104 -
 105
105 -
 106
106 -
 107
107 -
 108
108 -
 109
109 -
 110
110 -
 111
111 -
 112
112 -
 113
113 -
 114
114 -
 115
115 -
 116
116 -
 117
117 -
 118
118 -
119
-
120
-
121
-
122
-
123
-
124
-
125
-
126
-
127
-
128
-
129
-
130
-
131
-
132
-
133
-
134
-
135
-
136
-
137
-
138
-
139
-
140
 |
 |

106 GE 2010 ANNUAL REPORT
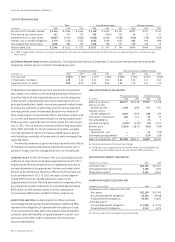
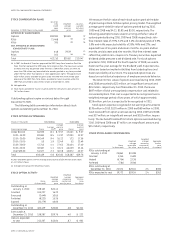
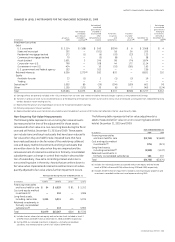
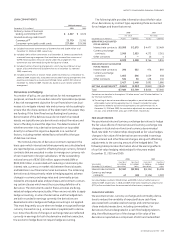
We measure the fair value of each stock option grant at the date
of grant using a Black-Scholes option pricing model. The weighted
average grant-date fair value of options granted during 2010,
2009 and 2008 was $4.11, $3.81 and $5.26, respectively. The
following assumptions were used in arriving at the fair value of
options granted during 2010, 2009 and 2008, respectively: risk-
free interest rates of 2.9%, 3.2% and 3.4%; dividend yields of 3.9%,
3.9% and 4.4%; expected volatility of 35%, 49% and 27%; and
expected lives of six years and eleven months, six years and ten
months, and six years and nine months. Risk-free interest rates
reflect the yield on zero-coupon U.S. Treasury securities. Expected
dividend yields presume a set dividend rate. For stock options
granted in 2010, 2009 and the fourth quarter of 2008, we used a
historical five-year average for the dividend yield. Expected vola-
tilities are based on implied volatilities from traded options and
historical volatility of our stock. The expected option lives are
based on our historical experience of employee exercise behavior.
The total intrinsic value of options exercised during 2010, 2009
and 2008 amounted to $23 million, an insignificant amount and
$45 million, respectively. As of December 31, 2010, there was
$697 million of total unrecognized compensation cost related to
nonvested options. That cost is expected to be recognized over a
weighted average period of two years, of which approximately
$236 million, pre tax, is expected to be recognized in 2011.
Stock option expense recognized in net earnings amounted to
$178 million in 2010, $120 million in 2009 and $69 million in 2008.
Cash received from option exercises during 2010, 2009 and 2008
was $37 million, an insignificant amount and $353 million, respec-
tively. The tax benefit realized from stock options exercised during
2010, 2009 and 2008 was $7 million, an insignificant amount and
$15 million, respectively.
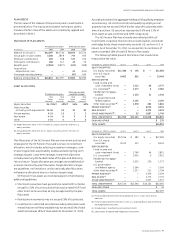
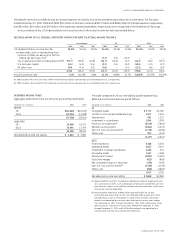
OTHER STOCK-BASED COMPENSATION
Weighted
Weighted average Aggregate
average remaining intrinsic
Shares grant date contractual value
(In thousands) fair value term (In years) (In millions)
RSUs outstanding at
January 1, 2010 25,861 $31.98
Granted 3,245 15.89
Vested (6,754) 33.38
Forfeited (781) 30.98
RSUs outstanding at
December 31, 2010 21,571 $29.16 2.5 $395
RSUs expected to vest 19,773 $29.24 2.4 $362
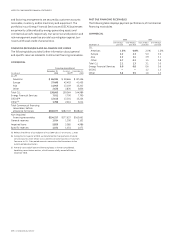
STOCK COMPENSATION PLANS
Securities
to be Weighted Securities
issued average available
upon exercise for future
December 31, 2010 (Shares in thousands) exercise price issuance
APPROVED BY SHAREOWNERS
Options 399,991 $20.81
(a)
RSUs 21,468 (b)
(a)
PSUs 700
(b)
(a)
NOT APPROVED BY SHAREOWNERS
(CONSULTANTS’ PLAN)
Options 448 29.39
(c)
RSUs 103 (b)
(c)
Total 422,710 $20.82 213,047
(a) In 2007, the Board of Directors approved the 2007 Long-Term Incentive Plan (the
Plan). The Plan replaced the 1990 Long-Term Incentive Plan. The maximum number
of shares that may be granted under the Plan is 500 million shares, of which no
more than 250 million may be available for awards granted in any form provided
under the Plan other than options or stock appreciation rights. The approximate
105.9 million shares available for grant under the 1990 Plan were retired upon
approval of the 2007 Plan. Total shares available for future issuance under the
2007 Plan amounted to 184.8 million shares at December 31, 2010.
(b) Not applicable.
(c) Total shares available for future issuance under the consultants’ plan amount to
28.2 million shares.
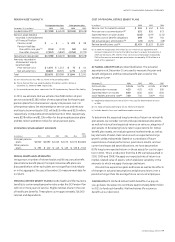
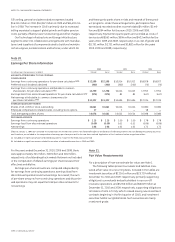
Outstanding options expire on various dates through
December 9, 2020.
The following table summarizes information about stock
options outstanding at December 31, 2010.
STOCK OPTIONS OUTSTANDING
(Shares in thousands) Outstanding
Exercisable
Average Average
Average exercise exercise
Exercise price range Shares life
(a) price Shares price
Under $10.00 64,595 8.1 $ 9.57 13,061 $ 9.57
10.01–15.00 83,081 8.5 11.97 17,093 11.97
15.01–20.00 104,149 9.4 16.22 173 17.56
20.01–25.00 55 1.9 22.49 55 22.49
25.01–30.00 47,745 4.4 27.62 35,404 27.40
30.01–35.00 49,487 4.1 33.21 46,629 33.16
Over $35.00 51,327 2.3 40.38 45,872 40.57
Total 400,439 6.8 $20.82 158,287 $29.76
At year-end 2009, options with an average exercise price of $36.94 were exercisable
on 147 million shares.
(a) Average contractual life remaining in years.
STOCK OPTION ACTIVITY
Weighted
Weighted average Aggregate
average remaining intrinsic
Shares exercise contractual value
(In thousands) price term (In years) (In millions)
Outstanding at
January 1, 2010 338,163 $24.41
Granted 105,227 16.22
Exercised (3,449) 10.65
Forfeited (8,223) 15.26
Expired (31,279) 46.66
Outstanding at
December 31, 2010 400,439 $20.82 6.8 $1,312
Exercisable at
December 31, 2010 158,287 $29.76 4.0 $ 222
Options expected
to vest 213,267 $15.04 8.7 $ 962