GE 2010 Annual Report Download - page 120
Download and view the complete annual report
Please find page 120 of the 2010 GE annual report below. You can navigate through the pages in the report by either clicking on the pages listed below, or by using the keyword search tool below to find specific information within the annual report.-
 1
1 -
2
-
3
-
4
-
5
-
6
-
7
-
8
-
9
-
10
-
11
-
12
-
13
-
14
-
15
-
16
-
17
-
18
-
19
-
20
-
21
-
22
-
23
-
24
-
25
-
26
-
27
-
28
-
29
-
30
-
31
-
32
-
33
-
34
-
35
-
36
-
37
-
38
-
39
-
40
-
41
-
42
-
43
-
44
-
45
-
46
-
47
-
48
-
49
-
50
-
51
-
52
-
53
-
54
-
55
-
56
-
57
-
58
-
59
-
60
-
61
-
62
-
63
-
64
-
65
-
66
-
67
-
68
-
69
-
70
-
71
-
72
-
73
-
74
-
75
-
76
-
77
-
78
-
79
-
80
-
81
-
82
-
83
-
84
-
85
-
86
-
87
-
88
-
89
-
90
-
91
-
92
-
93
-
94
-
95
-
96
-
97
-
98
-
99
-
100
-
101
-
102
-
103
-
104
-
105
-
106
-
107
-
108
-
109
-
 110
110 -
 111
111 -
 112
112 -
 113
113 -
 114
114 -
 115
115 -
 116
116 -
 117
117 -
 118
118 -
 119
119 -
 120
120 -
 121
121 -
 122
122 -
 123
123 -
 124
124 -
 125
125 -
 126
126 -
 127
127 -
 128
128 -
 129
129 -
 130
130 -
131
-
132
-
133
-
134
-
135
-
136
-
137
-
138
-
139
-
140
 |
 |

118 GE 2010 ANNUAL REPORT
such, these loans are not necessarily classified as nonearning
or impaired.
At December 31, 2010, our unsecured Commercial financing
receivables portfolio of $208 million, $964 million and $783 million
was rated A, B and C, respectively. Substantially all of these financ-
ing receivables are attributable to our Interbanca S.p.A. and
GE Sanyo Credit acquisitions in Europe and Asia, respectively.
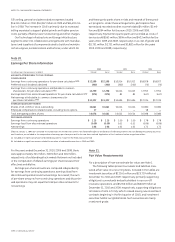
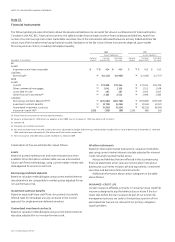
Real Estate
Our real estate portfolio primarily comprises fixed and floating
loans secured by commercial real estate. Our Debt portfolio is
underwritten based on the cash flows generated by underlying
income-producing commercial properties and secured by first
mortgages. Our Business properties portfolio is underwritten
primarily by the credit quality of the borrower and secured by
tenant and owner-occupied commercial properties.
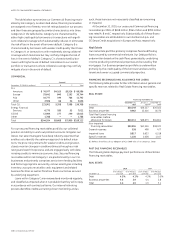
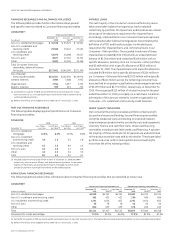
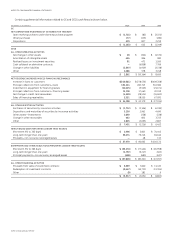
FINANCING RECEIVABLES AND ALLOWANCE FOR LOSSES
The following table provides further information about general and
specific reserves related to Real Estate financing receivables.
REAL ESTATE
Financing receivables at
December 31, January 1, December 31,
(In millions) 2010 2010
(a) 2009
Debt $30,249 $36,257 $36,565
Business properties 9,962 12,416 8,276
Total Real Estate financing
receivables, before
allowance for losses $40,211 $48,673 $44,841
Non-impaired
financing receivables $30,394 $42,050 $38,323
General reserves 338 498 477
Impaired loans 9,817 6,623 6,518
Specific reserves 1,150 1,038 1,017
(a) Reflects the effects of our adoption of ASU 2009-16 & 17 on January 1, 2010.
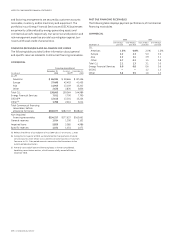
PAST DUE FINANCING RECEIVABLES
The following table displays payment performance of Real Estate
financing receivables.
REAL ESTATE
2010
2009
Over 30 days Over 90 days Over 30 days Over 90 days
December 31 past due past due past due past due
Debt 4.3 % 4.1 % 4.3 % 3.0 %
Business properties 4.6 3.9 4.4 3.8
Total 4.4 4.0 4.3 3.1
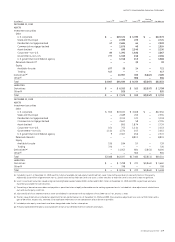
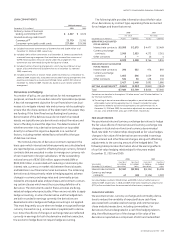
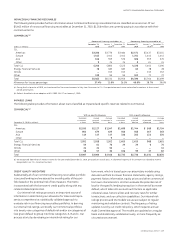
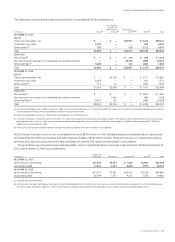
The table below summarizes our Commercial financing receiv-
ables by risk category. As described above, financing receivables
are assigned one of twenty-one risk ratings based on our process
and then these are grouped by similar characteristics into three
categories in the table below. Category A is characterized by
either high credit quality borrowers or transactions with signifi-
cant collateral coverage which substantially reduces or eliminates
the risk of loss in the event of borrower default. Category B is
characterized by borrowers with weaker credit quality than those
in Category A, or transactions with moderately strong collateral
coverage which minimizes but may not fully mitigate the risk of
loss in the event of default. Category C is characterized by bor-
rowers with higher levels of default risk relative to our overall
portfolio or transactions where collateral coverage may not fully
mitigate a loss in the event of default.
COMMERCIAL
Secured
December 31, 2010 (In millions) A B C Total
CLL
Americas $ 76,977 $4,103 $5,516 $ 86,596
Europe 33,642 840 1,262 35,744
Asia 10,777 199 766 11,742
Other 2,506 66 54 2,626
Total CLL 123,902 5,208 7,598 136,708
Energy Financial
Services 6,775 183 53 7,011
GECAS 12,089 277 249 12,615
Other 1,788 — — 1,788
Total $144,554 $5,668 $7,900 $158,122
For our secured financing receivables portfolio, our collateral
position and ability to work out problem accounts mitigates our
losses. Our asset managers have deep industry expertise that
enables us to identify the optimum approach to default situa-
tions. We price risk premiums for weaker credits at origination,
closely monitor changes in creditworthiness through our risk
ratings and watch list process, and are engaged early with dete-
riorating credits to minimize economic loss. Secured financing
receivables within risk Category C are predominantly in our CLL
businesses and primarily comprises senior term lending facilities
and factoring programs secured by various asset types including
inventory, accounts receivable, cash, equipment and related
business facilities as well as franchise finance activities secured
by underlying equipment.
Loans within Category C are reviewed and monitored regularly,
and classified as impaired when it is probable that they will not pay
in accordance with contractual terms. Our internal risk rating
process identifies credits warranting closer monitoring; and as