GE 2010 Annual Report Download - page 67
Download and view the complete annual report
Please find page 67 of the 2010 GE annual report below. You can navigate through the pages in the report by either clicking on the pages listed below, or by using the keyword search tool below to find specific information within the annual report.-
 1
1 -
2
-
3
-
4
-
5
-
6
-
7
-
8
-
9
-
10
-
11
-
12
-
13
-
14
-
15
-
16
-
17
-
18
-
19
-
20
-
21
-
22
-
23
-
24
-
25
-
26
-
27
-
28
-
29
-
30
-
31
-
32
-
33
-
34
-
35
-
36
-
37
-
38
-
39
-
40
-
41
-
42
-
43
-
44
-
45
-
46
-
47
-
48
-
49
-
50
-
51
-
52
-
53
-
54
-
55
-
56
-
 57
57 -
 58
58 -
 59
59 -
 60
60 -
 61
61 -
 62
62 -
 63
63 -
 64
64 -
 65
65 -
 66
66 -
 67
67 -
 68
68 -
 69
69 -
 70
70 -
 71
71 -
 72
72 -
 73
73 -
 74
74 -
 75
75 -
 76
76 -
 77
77 -
78
-
79
-
80
-
81
-
82
-
83
-
84
-
85
-
86
-
87
-
88
-
89
-
90
-
91
-
92
-
93
-
94
-
95
-
96
-
97
-
98
-
99
-
100
-
101
-
102
-
103
-
104
-
105
-
106
-
107
-
108
-
109
-
110
-
111
-
112
-
113
-
114
-
115
-
116
-
117
-
118
-
119
-
120
-
121
-
122
-
123
-
124
-
125
-
126
-
127
-
128
-
129
-
130
-
131
-
132
-
133
-
134
-
135
-
136
-
137
-
138
-
139
-
140
 |
 |

management’s discussion and analsis
GE 2010 ANNUAL REPORT 65
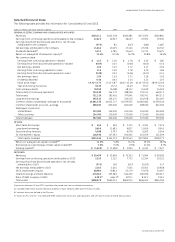
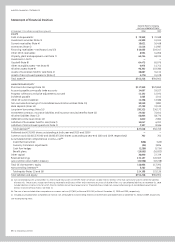
Selected Financial Data
The following table provides key information for Consolidated, GE and GECS.
(Dollars in millions; per-share amounts in dollars) 2010 2009 2008 2007 2006
GENERAL ELECTRIC COMPANY AND CONSOLIDATED AFFILIATES
Revenues $150,211 $155,278 $181,581 $ 171,556 $150,845
Earnings from continuing operations attributable to the Company 12,623 10,943 18,027 22,394 19,255
Earnings (loss) from discontinued operations, net of taxes,
attributable to the Company (979) 82 (617) (186) 1,487
Net earnings attributable to the Company 11,644 11,025 17,410 22,208 20,742
Dividends declared (a) 5,212 6,785 12,649 11,713 10,675
Return on average GE shareowners’ equity (b) 11.4% 10.5% 16.2% 20.8% 19.4%
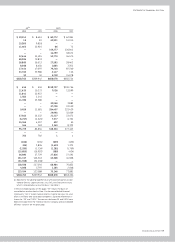
Per common share
Earnings from continuing operations—diluted $ 1.15 $ 1.00 $ 1.78 $ 2.19 $ 1.85
Earnings (loss) from discontinued operations—diluted (0.09) 0.01 (0.06) (0.02) 0.14
Net earnings—diluted 1.06 1.01 1.72 2.17 2.00
Earnings from continuing operations—basic 1.15 1.00 1.78 2.20 1.86
Earnings (loss) from discontinued operations—basic (0.09) 0.01 (0.06) (0.02) 0.14
Net earnings—basic 1.06 1.01 1.72 2.18 2.00
Dividends declared 0.46 0.61 1.24 1.15 1.03
Stock price range 19.70–13.75 17.52–5.87 38.52–12.58 42.15–33.90 38.49–32.06
Year-end closing stock price 18.29 15.13 16.20 37.07 37.21
Cash and equivalents 78,958 70,488 48,112 15,639 14,030
Total assets of continuing operations 745,938 766,773 788,906 779,112 669,371
Total assets 751,216 781,901 797,841 795,741 697,311
Long-term borrowings 293,323 336,172 320,503 314,978 255,067
Common shares outstanding—average (in thousands) 10,661,078 10,613,717 10,079,923 10,182,083 10,359,320
Common shareowner accounts—average 588,000 605,000 604,000 608,000 624,000
Employees at year end
United States 133,000 134,000 152,000 155,000 155,000
Other countries 154,000 170,000 171,000 172,000 164,000
Total employees 287,000 304,000 323,000 327,000 319,000
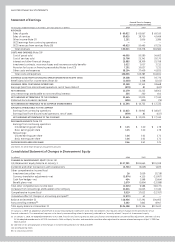
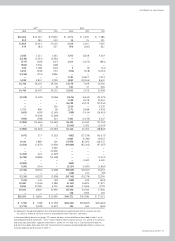
GE DATA
Short-term borrowings $ 456 $ 504 $ 2,375 $ 4,106 $ 2,076
Long-term borrowings 9,656 11,681 9,827 11,656 9,043
Noncontrolling interests 4,098 5,797 6,678 6,503 5,544
GE shareowners’ equity 118,936 117,291 104,665 115,559 111,509
Total capital invested $133,146 $ 135,273 $123,545 $ 137,824 $128,172
Return on average total capital invested (b) 11.2% 9.8% 15.1% 19.2% 18.2%
Borrowings as a percentage of total capital invested (b) 7.6% 9.0% 9.9% 11.4% 8.7%
Working capital (b) $ (1,618) $ (1,596) $ 3,904 $ 6,433 $ 7,527
GECS DATA
Revenues $ 50,499 $ 52,658 $ 70,353 $ 71,004 $ 60,628
Earnings from continuing operations attributable to GECS 3,130 1,315 7,712 12,354 10,131
Earnings (loss) from discontinued operations, net of taxes,
attributable to GECS (975) 100 (657) (2,053) 527
Net earnings attributable to GECS 2,155 1,415 7,055 10,301 10,658
GECS shareowner’s equity 68,984 70,833 53,279 57,676 54,097
Total borrowings and bank deposits 470,562 493,585 514,430 500,696 426,017
Ratio of debt to equity at GECC 6.39:1 (c) 6.66:1 (c) 8.79:1 8.14:1 7.50:1
Total assets $608,678 $650,324 $660,974 $646,543 $565,296
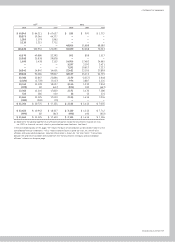
Transactions between GE and GECS have been eliminated from the consolidated information.
(a) Included $300 million of preferred stock dividends in both 2010 and 2009 and $75 million in 2008.
(b) Indicates terms are defined in the Glossary.
(c) Ratios of 4.94:1 and 5.17:1 for 2010 and 2009, respectively, net of cash and equivalents and with classification of hybrid debt as equity.