GE 2010 Annual Report Download - page 100
Download and view the complete annual report
Please find page 100 of the 2010 GE annual report below. You can navigate through the pages in the report by either clicking on the pages listed below, or by using the keyword search tool below to find specific information within the annual report.-
 1
1 -
2
-
3
-
4
-
5
-
6
-
7
-
8
-
9
-
10
-
11
-
12
-
13
-
14
-
15
-
16
-
17
-
18
-
19
-
20
-
21
-
22
-
23
-
24
-
25
-
26
-
27
-
28
-
29
-
30
-
31
-
32
-
33
-
34
-
35
-
36
-
37
-
38
-
39
-
40
-
41
-
42
-
43
-
44
-
45
-
46
-
47
-
48
-
49
-
50
-
51
-
52
-
53
-
54
-
55
-
56
-
57
-
58
-
59
-
60
-
61
-
62
-
63
-
64
-
65
-
66
-
67
-
68
-
69
-
70
-
71
-
72
-
73
-
74
-
75
-
76
-
77
-
78
-
79
-
80
-
81
-
82
-
83
-
84
-
85
-
86
-
87
-
88
-
89
-
 90
90 -
 91
91 -
 92
92 -
 93
93 -
 94
94 -
 95
95 -
 96
96 -
 97
97 -
 98
98 -
 99
99 -
 100
100 -
 101
101 -
 102
102 -
 103
103 -
 104
104 -
 105
105 -
 106
106 -
 107
107 -
 108
108 -
 109
109 -
 110
110 -
111
-
112
-
113
-
114
-
115
-
116
-
117
-
118
-
119
-
120
-
121
-
122
-
123
-
124
-
125
-
126
-
127
-
128
-
129
-
130
-
131
-
132
-
133
-
134
-
135
-
136
-
137
-
138
-
139
-
140
 |
 |

98 GE 2010 ANNUAL REPORT
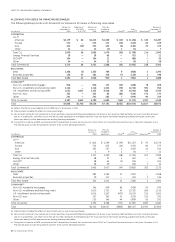
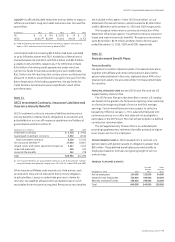
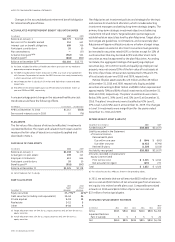
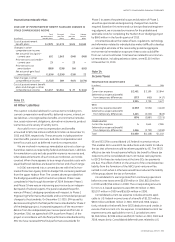
The following tables present the changes in Level 3 investments for the GE Pension Plan.
CHANGES IN LEVEL 3 INVESTMENTS FOR THE YEAR ENDED DECEMBER 31, 2010
Net change
in unrealized
gains (losses)
relating to
Purchases, Transfers investments
Net realized/ issuances in and/or still held at
January 1, unrealized and out of December 31, December 31,
(In millions) 2010 gains (losses) settlements Level 3
(a) 2010 2010
(b)
DEBT SECURITIES
Fixed income and cash investment funds $ 46 $ 16 $ 3 $ — $ 65 $ 15
U.S. corporate 6 7 (9) 1 5 1
Residential mortgage-backed 220 6 (211) 6 21 1
Other debt securities 231 17 41 (6) 283 15
PRIVATE EQUITIES 5,339 748 (73) — 6,014 694
REAL ESTATE 2,775 381 217 — 3,373 251
OTHER INVESTMENTS 1,537 132 65 (47) 1,687 156
$10,154 $1,307 $ 33 $(46) $11,448
$1,133
(a) Transfers in and out of Level 3 are considered to occur at the beginning of the period.
(b) The net change in unrealized gains (losses) was included in the year-end asset value.
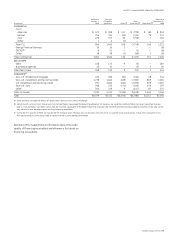
CHANGES IN LEVEL 3 INVESTMENTS FOR THE YEAR ENDED DECEMBER 31, 2009
Net change
in unrealized
gains (losses)
relating to
Purchases, Transfers investments
Net realized/ issuances in and/or still held at
January 1, unrealized and out of December 31, December 31,
(In millions) 2009 gains (losses) settlements Level 3
(a) 2009 2009
(b)
EQUITY SECURITIES
Non-U.S. equity securities $ 358 $ (8) $(350) $ — $ — $ —
DEBT SECURITIES
Fixed income and cash investment funds — 3 43 — 46 3
U.S. corporate 21 (1) (12) (2) 6 (7)
Residential mortgage-backed 64 15 124 17 220 (33)
Other debt securities 223 5 3 — 231 (23)
PRIVATE EQUITIES 4,893 88 358 — 5,339 23
REAL ESTATE 4,944 (2,225) 56 — 2,775 (2,407)
OTHER INVESTMENTS 1,613 192 (268) — 1,537 (30)
$12,116 $(1,931) $ (46) $15 $10,154 $(2,474)
(a) Transfers in and out of Level 3 are considered to occur at the beginning of the period.
(b) The net change in unrealized gains (losses) was included in the year-end asset value.
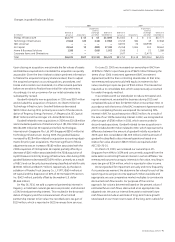
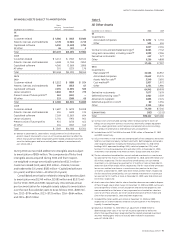
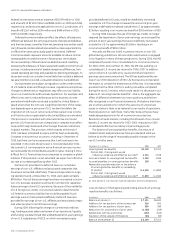
Other pension plans’ assets were $7,803 million and $6,919 million at December 31, 2010 and 2009, respectively. Equity and debt securi-
ties amounting to $6,938 million and $6,517 million represented approximately 90% and 95% of total investments at December 31, 2010
and 2009, respectively. The plans’ investments were classified as 15% Level 1, 75% Level 2 and 10% Level 3 at December 31, 2010. The
plans’ investments were classified as 15% Level 1, 80% Level 2 and 5% Level 3 at December 31, 2009. The changes in Level 3 investments
were insignificant for the years ended December 31, 2010 and 2009.