GE 2010 Annual Report Download - page 70
Download and view the complete annual report
Please find page 70 of the 2010 GE annual report below. You can navigate through the pages in the report by either clicking on the pages listed below, or by using the keyword search tool below to find specific information within the annual report.-
 1
1 -
2
-
3
-
4
-
5
-
6
-
7
-
8
-
9
-
10
-
11
-
12
-
13
-
14
-
15
-
16
-
17
-
18
-
19
-
20
-
21
-
22
-
23
-
24
-
25
-
26
-
27
-
28
-
29
-
30
-
31
-
32
-
33
-
34
-
35
-
36
-
37
-
38
-
39
-
40
-
41
-
42
-
43
-
44
-
45
-
46
-
47
-
48
-
49
-
50
-
51
-
52
-
53
-
54
-
55
-
56
-
57
-
58
-
59
-
 60
60 -
 61
61 -
 62
62 -
 63
63 -
 64
64 -
 65
65 -
 66
66 -
 67
67 -
 68
68 -
 69
69 -
 70
70 -
 71
71 -
 72
72 -
 73
73 -
 74
74 -
 75
75 -
 76
76 -
 77
77 -
 78
78 -
 79
79 -
 80
80 -
81
-
82
-
83
-
84
-
85
-
86
-
87
-
88
-
89
-
90
-
91
-
92
-
93
-
94
-
95
-
96
-
97
-
98
-
99
-
100
-
101
-
102
-
103
-
104
-
105
-
106
-
107
-
108
-
109
-
110
-
111
-
112
-
113
-
114
-
115
-
116
-
117
-
118
-
119
-
120
-
121
-
122
-
123
-
124
-
125
-
126
-
127
-
128
-
129
-
130
-
131
-
132
-
133
-
134
-
135
-
136
-
137
-
138
-
139
-
140
 |
 |

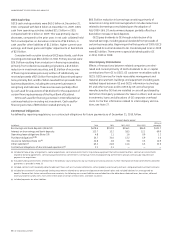
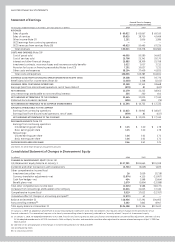
68 GE 2010 ANNUAL REPORT
audited financial statements
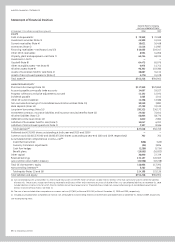
Statement of Financial Position
General Electric Company
and consolidated affiliates
At December 31 (In millions, except share amounts) 2010 2009
ASSETS
Cash and equivalents $ 78,958 $ 70,488
Investment securities (Note 3) 43,938 51,343
Current receivables (Note 4) 18,621 16,458
Inventories (Note 5) 11,526 11,987
Financing receivables—net (Notes 6 and 23) 310,055 319,247
Other GECS receivables 8,951 14,056
Property, plant and equipment—net (Note 7) 66,214 68,970
Investment in GECS — —
Goodwill (Note 8) 64,473 65,076
Other intangible assets—net (Note 8) 9,973 11,751
All other assets (Note 9) 96,342 103,286
Assets of businesses held for sale (Note 2) 36,887 34,111
Assets of discontinued operations (Note 2) 5,278 15,128
Total assets (a) $751,216 $781,901
LIABILITIES AND EQUITY
Short-term borrowings (Note 10) $117,959 $129,869
Accounts payable, principally trade accounts 14,657 19,527
Progress collections and price adjustments accrued 11,142 12,192
Dividends payable 1,563 1,141
Other GE current liabilities 11,396 13,386
Non-recourse borrowings of consolidated securitization entities (Note 10) 30,060 3,883
Bank deposits (Note 10) 37,298 33,519
Long-term borrowings (Note 10) 293,323 336,172
Investment contracts, insurance liabilities and insurance annuity benefits (Note 11) 29,582 31,641
All other liabilities (Note 13) 58,844 58,776
Deferred income taxes (Note 14) 2,840 2,081
Liabilities of businesses held for sale (Note 2) 16,047 6,092
Liabilities of discontinued operations (Note 2) 2,307 8,486
Total liabilities (a) 627,018 656,765
Preferred stock (30,000 shares outstanding at both year-end 2010 and 2009) — —
Common stock (10,615,376,000 and 10,663,075,000 shares outstanding at year-end 2010 and 2009, respectively) 702 702
Accumulated other comprehensive income—net (b)
Investment securities (636) (435)
Currency translation adjustments (86) 3,836
Cash flow hedges (1,280) (1,734)
Benefit plans (15,853) (16,932)
Other capital 36,890 37,729
Retained earnings 131,137 126,363
Less common stock held in treasury (31,938) (32,238)
Total GE shareowners’ equity 118,936 117,291
Noncontrolling interests (c) 5,262 7,845
Total equity (Notes 15 and 16) 124,198 125,136
Total liabilities and equity $751,216 $781,901
(a) Our consolidated assets at December 31, 2010 include total assets of $49,295 million of certain variable interest entities (VIEs) that can only be used to settle the liabilities
of those VIEs. These assets include net financing receivables of $38,612 million and investment securities of $6,670 million. Our consolidated liabilities at December 31, 2010
include liabilities of certain VIEs for which the VIE creditors do not have recourse to GE. These liabilities include non-recourse borrowings of consolidated securitization
entities (CSEs) of $29,444 million. See Note 24.
(b) The sum of accumulated other comprehensive income—net was $(17,855) million and $(15,265) million at December 31, 2010 and 2009, respectively.
(c) Included accumulated other comprehensive income—net attributable to noncontrolling interests of $(153) million and $(188) million at December 31, 2010 and 2009, respectively.
See accompanying notes.