GE 2010 Annual Report Download - page 121
Download and view the complete annual report
Please find page 121 of the 2010 GE annual report below. You can navigate through the pages in the report by either clicking on the pages listed below, or by using the keyword search tool below to find specific information within the annual report.-
 1
1 -
2
-
3
-
4
-
5
-
6
-
7
-
8
-
9
-
10
-
11
-
12
-
13
-
14
-
15
-
16
-
17
-
18
-
19
-
20
-
21
-
22
-
23
-
24
-
25
-
26
-
27
-
28
-
29
-
30
-
31
-
32
-
33
-
34
-
35
-
36
-
37
-
38
-
39
-
40
-
41
-
42
-
43
-
44
-
45
-
46
-
47
-
48
-
49
-
50
-
51
-
52
-
53
-
54
-
55
-
56
-
57
-
58
-
59
-
60
-
61
-
62
-
63
-
64
-
65
-
66
-
67
-
68
-
69
-
70
-
71
-
72
-
73
-
74
-
75
-
76
-
77
-
78
-
79
-
80
-
81
-
82
-
83
-
84
-
85
-
86
-
87
-
88
-
89
-
90
-
91
-
92
-
93
-
94
-
95
-
96
-
97
-
98
-
99
-
100
-
101
-
102
-
103
-
104
-
105
-
106
-
107
-
108
-
109
-
110
-
 111
111 -
 112
112 -
 113
113 -
 114
114 -
 115
115 -
 116
116 -
 117
117 -
 118
118 -
 119
119 -
 120
120 -
 121
121 -
 122
122 -
 123
123 -
 124
124 -
 125
125 -
 126
126 -
 127
127 -
 128
128 -
 129
129 -
 130
130 -
 131
131 -
132
-
133
-
134
-
135
-
136
-
137
-
138
-
139
-
140
 |
 |

GE 2010 ANNUAL REPORT 119
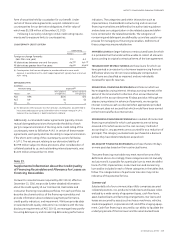
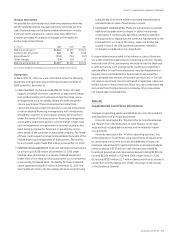
with loan-to-value ratios greater than 95% are paying in accor-
dance with contractual terms. Substantially all of these loans and
substantially all of the Real Estate—Business properties financing
receivables included in Category C are impaired loans which are
subject to the specific reserve evaluation process described in
Note 1. The ultimate recoverability of impaired loans is driven by
collection strategies that do not necessarily depend on the sale of
the underlying collateral and include full or partial repayments
through third-party refinancing and restructurings.
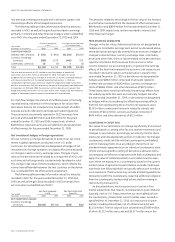
Consumer
Our Consumer portfolio is largely non-U.S. and primarily comprises
residential mortgage, sales finance, and auto and personal loans in
various European and Asian countries. At December 31, 2010, our
U.S. consumer financing receivables included private-label credit
card and sales financing for over 51 million customers across the
U.S. with no metropolitan area accounting for more than 6% of the
portfolio. Of the total U.S. consumer financing receivables, approxi-
mately 63% relate to credit card loans, which are often subject to
profit and loss sharing arrangements with the retailer (which are
recorded in revenues), and the remaining 37% are sales finance
receivables, which provide financing to customers in areas such
as electronics, recreation, medical and home improvement.
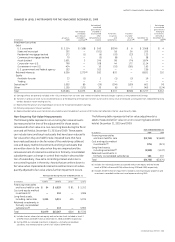
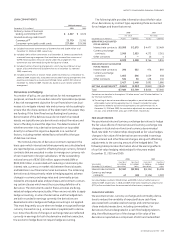
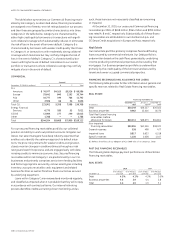
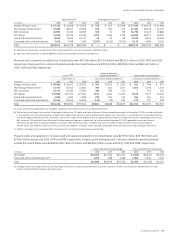
CREDIT QUALITY INDICATORS
Due to the primarily non-recourse nature of our Debt portfolio,
loan-to-value ratios provide the best indicators of the credit
quality of the portfolio. By contrast, the credit quality of the
Business properties portfolio is primarily influenced by the
strength of the borrower’s general credit quality, which is
reflected in our internal risk rating process, consistent with the
process we use for our Commercial portfolio.
Loan-to-value ratio
Less than 80% to Greater than
December 31, 2010 (In millions) 80% 95% 95%
Debt $12,362 $9,392 $8,495
Internal risk rating
December 31, 2010 (In millions) A B C
Business properties $ 8,746 $ 437 $ 779
Within Real Estate, these financing receivables are primarily
concentrated in our North American and European Lending
platforms and are secured by various property types. Collateral
values for Real Estate—Debt financing receivables are updated at
least semi-annually, or more frequently for higher risk loans. A
substantial majority of the Real Estate—Debt financing receivables
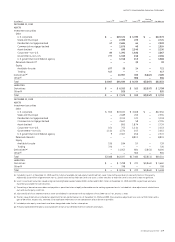
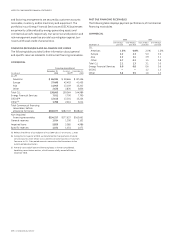
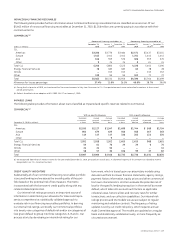
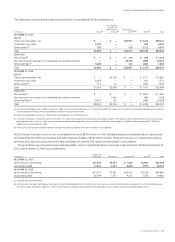
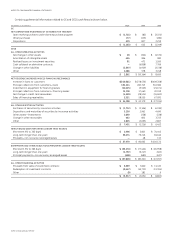
NONACCRUAL FINANCING RECEIVABLES
The following table provides further information about Real Estate financing receivables that are classified as nonaccrual. Of our $9,719 mil-
lion of nonaccrual financing receivables at December 31, 2010, $7,888 million are currently paying in accordance with their contractual terms.
REAL ESTATE
Nonaccrual financing receivables at Nonearning financing receivables at
December 31, January 1, December 31, December 31, January 1, December 31,
(Dollars in millions) 2010 2010
(a) 2009 2010 2010
(a) 2009
Debt $9,039 $6,342 $6,649 $ 961 $ 939 $ 939
Business properties 680 493 388 386 419 313
Total $9,719 $6,835 $7,037 $1,347 $1,358 $1,252
Allowance for losses percentage 15.3% 22.5% 21.2% 110.5% 113.1% 119.3%
(a) Reflects the effects of our adoption of ASU 2009-16 & 17 on January 1, 2010.
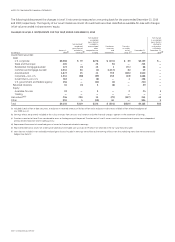
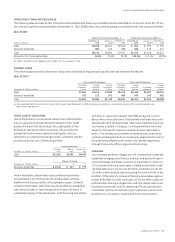
IMPAIRED LOANS
The following table provides information about loans classified as impaired and specific reserves related to Real Estate.
REAL ESTATE
(a)
With no specific allowance With a specific allowance
Recorded Unpaid Average Recorded Unpaid Average
investment principal investment investment principal Associated investment
December 31, 2010 (In millions) in loans balance in loans in loans balance allowance in loans
Debt $2,814 $2,873 $1,598 $6,323 $6,498 $1,007 $6,116
Business properties 191 213 141 489 476 143 382
Total $3,005 $3,086 $1,739 $6,812 $6,974 $1,150 $6,498
(a) We recognized $189 million of interest income for the year ended December 31, 2010, principally on a cash basis. A substantial majority of this amount related to our
Real Estate—Debt business.