GE 2010 Annual Report Download - page 64
Download and view the complete annual report
Please find page 64 of the 2010 GE annual report below. You can navigate through the pages in the report by either clicking on the pages listed below, or by using the keyword search tool below to find specific information within the annual report.-
 1
1 -
2
-
3
-
4
-
5
-
6
-
7
-
8
-
9
-
10
-
11
-
12
-
13
-
14
-
15
-
16
-
17
-
18
-
19
-
20
-
21
-
22
-
23
-
24
-
25
-
26
-
27
-
28
-
29
-
30
-
31
-
32
-
33
-
34
-
35
-
36
-
37
-
38
-
39
-
40
-
41
-
42
-
43
-
44
-
45
-
46
-
47
-
48
-
49
-
50
-
51
-
52
-
53
-
 54
54 -
 55
55 -
 56
56 -
 57
57 -
 58
58 -
 59
59 -
 60
60 -
 61
61 -
 62
62 -
 63
63 -
 64
64 -
 65
65 -
 66
66 -
 67
67 -
 68
68 -
 69
69 -
 70
70 -
 71
71 -
 72
72 -
 73
73 -
 74
74 -
75
-
76
-
77
-
78
-
79
-
80
-
81
-
82
-
83
-
84
-
85
-
86
-
87
-
88
-
89
-
90
-
91
-
92
-
93
-
94
-
95
-
96
-
97
-
98
-
99
-
100
-
101
-
102
-
103
-
104
-
105
-
106
-
107
-
108
-
109
-
110
-
111
-
112
-
113
-
114
-
115
-
116
-
117
-
118
-
119
-
120
-
121
-
122
-
123
-
124
-
125
-
126
-
127
-
128
-
129
-
130
-
131
-
132
-
133
-
134
-
135
-
136
-
137
-
138
-
139
-
140
 |
 |
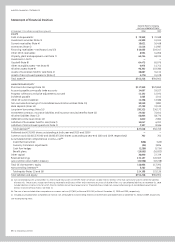
management’s discussion and analsis
62 GE 2010 ANNUAL REPORT
valuations, we used cash flows that reflected management’s
forecasts and discount rates that included risk adjustments con-
sistent with the current market conditions. Based on the results of
our step one testing, the fair values of each of the GE Industrial
reporting units and the CLL, Consumer, Energy Financial Services
and GECAS reporting units exceeded their carrying values; there-
fore, the second step of the impairment test was not required to
be performed and no goodwill impairment was recognized.
Our Real Estate reporting unit had a goodwill balance of
$1.1 billion at December 31, 2010. As of July 1, 2010, the carrying
amount exceeded the estimated fair value of our Real Estate
reporting unit by approximately $3.2 billion. The estimated fair
value of the Real Estate reporting unit is based on a number of
assumptions about future business performance and investment,
including loss estimates for the existing finance receivable and
investment portfolio, new debt origination volume and margins,
and anticipated stabilization of the real estate market allowing
for sales of real estate investments at normalized margins. Our
assumed discount rate was 12% and was derived by applying a
capital asset pricing model and corroborated using equity analyst
research reports and implied cost of equity based on forecasted
price to earnings per share multiples for similar companies. Given
the volatility and uncertainty in the current commercial real estate
environment, there is uncertainty about a number of assump-
tions upon which the estimated fair value is based. Different loss
estimates for the existing portfolio, changes in the new debt
origination volume and margin assumptions, changes in the
expected pace of the commercial real estate market recovery, or
changes in the equity return expectation of market participants
may result in changes in the estimated fair value of the Real Estate
reporting unit.
Based on the results of the step one testing, we performed the
second step of the impairment test described above. Based on
the results of the second step analysis for the Real Estate report-
ing unit, the estimated implied fair value of goodwill exceeded
the carrying value of goodwill by approximately $3.5 billion.
Accordingly, no goodwill impairment was required. In the sec-
ond step, unrealized losses in an entity’s assets have the effect of
increasing the estimated implied fair value of goodwill. The results
of the second step analysis were attributable to several factors.
The primary driver was the excess of the carrying value over the
estimated fair value of our Real Estate equity investments, which
approximated $6.3 billion at that time. Further information about
the Real Estate investment portfolio is provided in the Financial
Resources and Liquidity—Statement of Financial Position—All
Other Assets section. Other drivers for the favorable outcome
include the unrealized losses in the Real Estate finance receivable
portfolio and the fair value premium on the Real Estate reporting
unit allocated debt. The results of the second step analysis are
highly sensitive to these measurements, as well as the key
assumptions used in determining the estimated fair value of
the Real Estate reporting unit.
Estimating the fair value of reporting units requires the use of
estimates and significant judgments that are based on a number
of factors including actual operating results. If current conditions
persist longer or deteriorate further than expected, it is reason-
ably possible that the judgments and estimates described above
could change in future periods.
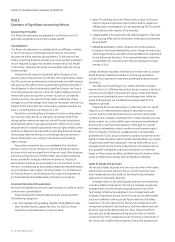
We review identified intangible assets with defined useful lives
and subject to amortization for impairment whenever events or
changes in circumstances indicate that the related carrying
amounts may not be recoverable. Determining whether an
impairment loss occurred requires comparing the carrying
amount to the sum of undiscounted cash flows expected to be
generated by the asset. We test intangible assets with indefinite
lives annually for impairment using a fair value method such as
discounted cash flows. For our insurance activities remaining in
continuing operations, we periodically test for impairment our
deferred acquisition costs and present value of future profits.
Further information is provided in the Financial Resources and
Liquidity—Goodwill and Other Intangible Assets section and in
Notes 1 and 8.
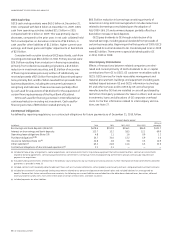
PENSION ASSUMPTIONS are significant inputs to the actuarial
models that measure pension benefit obligations and related
effects on operations. Two assumptions—discount rate
and expected return on assets—are important elements of plan
expense and asset/liability measurement. We evaluate these
critical assumptions at least annually on a plan and country-
specific basis. We periodically evaluate other assumptions
involving demographic factors, such as retirement age, mortality
and turnover, and update them to reflect our experience and
expectations for the future. Actual results in any given year will
often differ from actuarial assumptions because of economic
and other factors.
Accumulated and projected benefit obligations are measured
as the present value of future cash payments. We discount those
cash payments using the weighted average of market-observed
yields for high-quality fixed income securities with maturities that
correspond to the payment of benefits. Lower discount rates
increase present values and subsequent-year pension expense;
higher discount rates decrease present values and subsequent-
year pension expense.
Our discount rates for principal pension plans at December 31,
2010, 2009 and 2008 were 5.28%, 5.78% and 6.11%, respectively,
reflecting market interest rates.
To determine the expected long-term rate of return on pen-
sion plan assets, we consider current and expected asset
allocations, as well as historical and expected returns on various
categories of plan assets. In developing future return expecta-
tions for our principal benefit plans’ assets, we evaluate general
market trends as well as key elements of asset class returns such
as expected earnings growth, yields and spreads. Assets in our
principal pension plans earned 13.5% in 2010, and had average
annual earnings of 4.1%, 7.9% and 9.5% per year in the 10-,
15- and 25-year periods ended December 31, 2010, respectively.
These average historical returns were significantly affected by
investment losses in 2008. Based on our analysis of future expec-
tations of asset performance, past return results, and our current
and expected asset allocations, we have assumed an 8.0%