GE 2010 Annual Report Download - page 118
Download and view the complete annual report
Please find page 118 of the 2010 GE annual report below. You can navigate through the pages in the report by either clicking on the pages listed below, or by using the keyword search tool below to find specific information within the annual report.-
 1
1 -
2
-
3
-
4
-
5
-
6
-
7
-
8
-
9
-
10
-
11
-
12
-
13
-
14
-
15
-
16
-
17
-
18
-
19
-
20
-
21
-
22
-
23
-
24
-
25
-
26
-
27
-
28
-
29
-
30
-
31
-
32
-
33
-
34
-
35
-
36
-
37
-
38
-
39
-
40
-
41
-
42
-
43
-
44
-
45
-
46
-
47
-
48
-
49
-
50
-
51
-
52
-
53
-
54
-
55
-
56
-
57
-
58
-
59
-
60
-
61
-
62
-
63
-
64
-
65
-
66
-
67
-
68
-
69
-
70
-
71
-
72
-
73
-
74
-
75
-
76
-
77
-
78
-
79
-
80
-
81
-
82
-
83
-
84
-
85
-
86
-
87
-
88
-
89
-
90
-
91
-
92
-
93
-
94
-
95
-
96
-
97
-
98
-
99
-
100
-
101
-
102
-
103
-
104
-
105
-
106
-
107
-
 108
108 -
 109
109 -
 110
110 -
 111
111 -
 112
112 -
 113
113 -
 114
114 -
 115
115 -
 116
116 -
 117
117 -
 118
118 -
 119
119 -
 120
120 -
 121
121 -
 122
122 -
 123
123 -
 124
124 -
 125
125 -
 126
126 -
 127
127 -
 128
128 -
129
-
130
-
131
-
132
-
133
-
134
-
135
-
136
-
137
-
138
-
139
-
140
 |
 |

116 GE 2010 ANNUAL REPORT
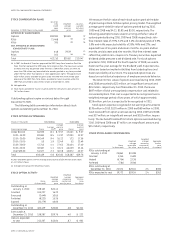
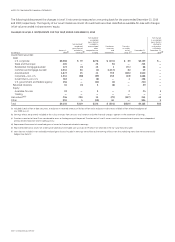
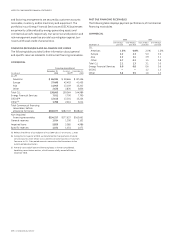
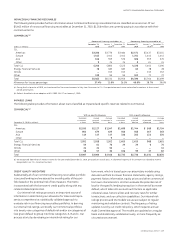
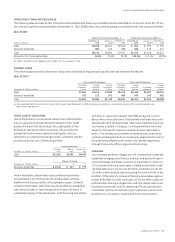
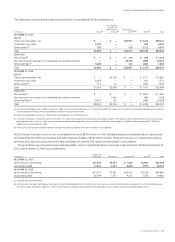
PAST DUE FINANCING RECEIVABLES
The following table displays payment performance of Commercial
financing receivables.
COMMERCIAL
2010 2009
Over 30 days Over 90 days Over 30 days Over 90 days
December 31 past due past due past due past due
CLL
Americas 1.3 % 0.8 % 2.1 % 1.5 %
Europe 4.2 2.3 5.0 3.0
Asia 2.2 1.4 3.9 3.1
Other 0.7 0.3 1.5 0.8
Total CLL 2.1 1.3 3.1 2.0
Energy Financial Services 0.9 0.8 0.6 0.6
GECAS — — 1.2 1.2
Other 5.8 5.5 1.6 1.3
and factoring arrangements are secured by customer accounts
receivable, inventory, and/or machinery and equipment. The
portfolios in our Energy Financial Services and GECAS businesses
are primarily collateralized by energy generating assets and
commercial aircraft, respectively. Our senior secured position and
risk management expertise provide loss mitigation against bor-
rowers with weak credit characteristics.
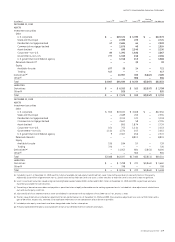
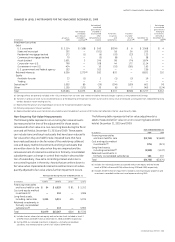
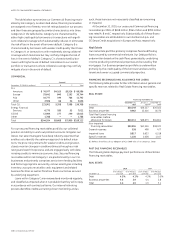
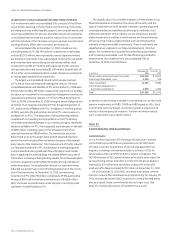
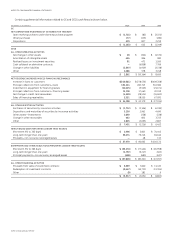
FINANCING RECEIVABLES AND ALLOWANCE FOR LOSSES
The following table provides further information about general
and specific reserves related to Commercial financing receivables.
COMMERCIAL
Financing receivables at
December 31, January 1, December 31,
(In millions) 2010 2010 (a) 2009
CLL (b)
Americas $ 86,596 $ 99,666 $ 87,496
Europe 37,498 43,403 41,455
Asia 11,943 13,159 13,202
Other 2,626 2,836 2,836
Total CLL 138,663 159,064 144,989
Energy Financial Services 7,011 7,790 7,790
GECAS (b) 12,615 13,254 13,254
Other
(c) 1,788 2,614 2,614
Total Commercial financing
receivables, before
allowance for losses $160,077 $182,722 $168,647
Non-impaired
financing receivables $154,257 $177,637 $163,661
General reserves 1,014 1,200 1,102
Impaired loans 5,820 5,085 4,986
Specific reserves 1,031 1,031 1,073
(a) Reflects the effects of our adoption of ASU 2009-16 & 17 on January 1, 2010.
(b) During the first quarter of 2010, we transferred the Transportation Financial
Services business from GECAS to CLL and the Consumer business in Italy from
Consumer to CLL. Prior-period amounts were reclassified to conform to the
current-period presentation.
(c) Primarily consisted of loans and financing leases in former consolidated,
liquidating securitization entities, which became wholly owned affiliates in
December 2010.